There is only one fixed income ETF focusing on 10 year Indian government bonds and one liquid ETF. The fixed income ETF is relatively new while the money market ETF has been there since 2003.
Exhibit 2: Quarterly average asset under management of ETFs in India. Date as of June 30, 2015
Source: S&P Dow Jones Indices, Morningstar, Association of Mutual Funds of India, Factset and Bloomberg
The liquidity profiles of the ETFs also reveal some interesting facets of this industry. Historically the gold ETFs combined have remained most liquid followed by money market ETF. But in more recent times, money market ETF has been the most liquid ETF and equity ETFs combined have been the second most liquid ETFs (see Exhibit 3). During 2011 through 2012, gold ETFs were aggressively pursued by the investors. In Q3 2011, the combined quarterly average daily value traded of the gold ETFs was more than INR 800mn. Since Q2 2013, the liquidity has reduced which is also augmented by the fact that the asset under the management have declined since then.
Exhibit 3: Average daily traded value of ETFs in India. Date as of June 30, 2015
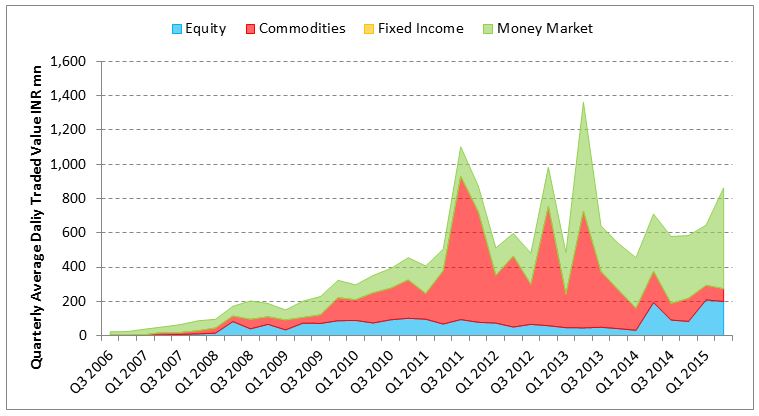
Source: S&P Dow Jones Indices, Morningstar, Association of Mutual Funds of India, Factset and Bloomberg
The ETF industry in India has been very dynamic over the years and it is still growing. Unlike some of the developed nations where active ETFs also exist, India only has passive ETFs. Indices play a major role in the functioning of the passive ETFs which simply try to mirror the benchmark index they are based on. With more and more investors becoming aware of the potential advantages of this investment product, it will continue to grow and help investors in their quest for diversification with lesser cost and tax efficiency.
