The World is Awash in Oil
Global supply/demand remains out of balance as producers rush supply into a slowing market…(Exhibit 5):
Exhibit 5: Global Supply vs Demand and the 12-Month NYMEX Oil Strip
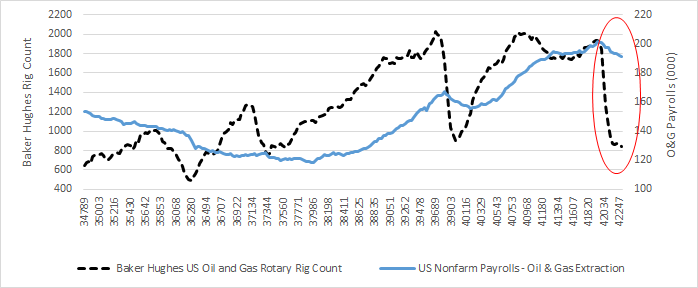
…Despite a drop in U.S. rig counts and nonfarm oil/gas employee payrolls (Exhibit 6):
Exhibit 6: Baker Hughes US Rig Count vs Nonfarm Oil/Gas Payrolls
This, of course, is not lost on the investment community as speculators hold a record net short position in futures contracts (Exhibit 7):
Exhibit 7: # of Long and Short Crude Light Sweet Oil Futures Contracts: Non-Commercial
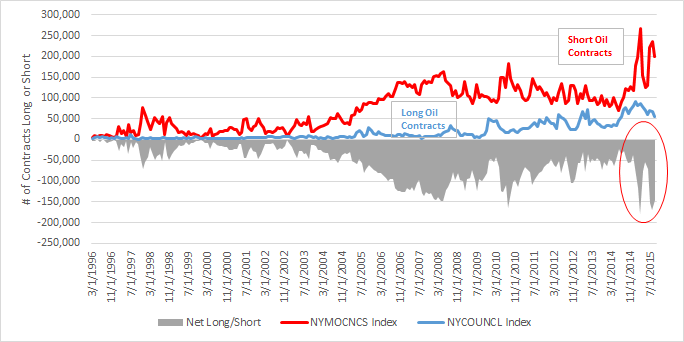
(Source: CFTC & NYMEX; data through 9/30/2015)
How energy performs will also determine how ‘value’ performs. Oil & Gas comprise ~10% of the CRSP US Large Value Index and ~20% for factor-weighted value indices such as the S&P Pure Value Index. YTD through 10/20/2015, the S&P Energy sector and S&P Pure Value are down 12.6% and 7.2%, respectively, although they had been down 21.3% and 12.9%, respectively, through 9/30/2015.
Riding Out Until the End
Regardless of who runs out of time first (OPEC or US Shale), fossil fuel consumption will not likely change over the near-term and global oil demand will continue to grow, albeit at a slower pace. For those tactical investors that have successfully navigated the energy swings, my hat off to you. As strategic investors, one must adopt a long-term perspective and ride out the short-term fluctuations. The volatility in energy reinforces the importance of long-term investing and diversification as such volatility has a knack for showing up in unexpected places.
This article originally appeared on 3Dadvisors.com
