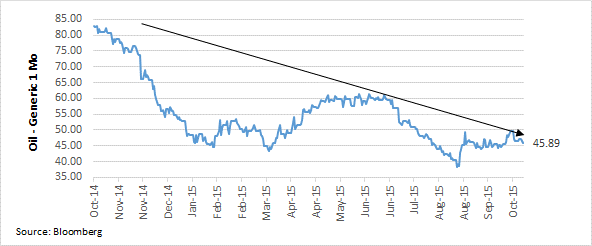
Generic crude oil has dropped to $45 following the latest Department of Energy report showing an 8.028-million-barrel inventory build in crude stocks, the largest inventory build over the last 6 months. It looked like energy was on the mend following the steep 3Q sell-off which saw prices drop from $55-60 to $38-40 and then recovering to the high $40s (Exhibit 1). Over the past year when OPEC first announced it was going to target market share at its Fall 2014 meeting, oil has dropped 46% from year-ago levels. During the 2nd quarter, oil recovered to $55-60 before dropping again over global supply concerns exasperated by slowing global industrial activity, notably in China.
Exhibit 1: Generic Oil 1 Month Contract (1-Year Ending 10/19/2015)
Supply continues to remain an overhang as OPEC and U.S. energy producers fight to see who can hold out the longest. Many of the U.S. producers are highly leveraged and are facing an October redetermination by their creditors where lower oil prices could trigger a massive withdrawal of debt financing. However, it appears many of these companies have gotten a reprieve until next spring as their bankers have decided to roll over their credit lines until the next review. The volatile price swings and blow-out in U.S. credit spreads suggested that the Saudis would prevail as we approached the October calendar, but the IMF released a report suggesting that the Saudis may be closer to the cliff despite being the world’s lowest cost producer. OPEC nations hoped they could squeeze the higher marginal cost producers out of their needed financing, but the race to the bottom will have to continue until bank financing or OPEC public financing dries up. For tactical, sector-rotation investors, the roller coaster ride has been anything but great. Consider the daily gyrations of the S&P energy sector’s return ranking (out of 10 sectors) since the start of the third quarter (Exhibit 2):
Exhibit 2: S&P Energy Daily Return Rank vs the Other Nine Sectors (7/1/2015-10/20/2015)
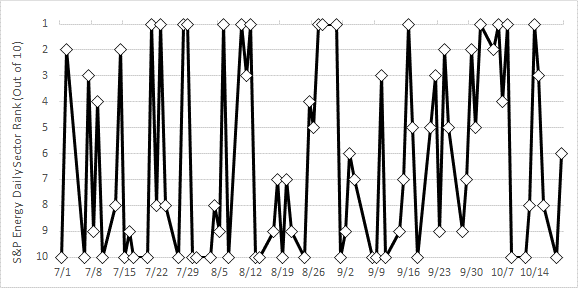
To put this in additional perspective, the median daily rank change for the energy sector was ‘4’ compared to an average ‘2.3’ median rank change for the other nine sectors. Energy was either the best or worst performing sector 48% of the time versus an average 17% for the other nine sectors. Utilities had a higher percentage (49%) but utilities were the top performer 31% of the time over this period. The ride hasn’t been any easier for credit investors where energy comprises ~12-13% of both the Merrill Lynch High Yield (Bloomberg H0A0) and Corporate Master (Bloomberg C0A0) indices. Exhibits 3 and 4 show the credit spreads of the energy sectors versus the broader indices. With spreads blowing out resulting in significant capital losses, investors striving for yield have been gifted with a dose of equity beta; this is a reminder that high yield is an asset class to rent not own (more on that in another piece).
Exhibit 3: Investment Grade Corporate Option-Adjusted Spreads Comparing the Energy Sector Versus All Sectors (Source: Bloomberg FICM)
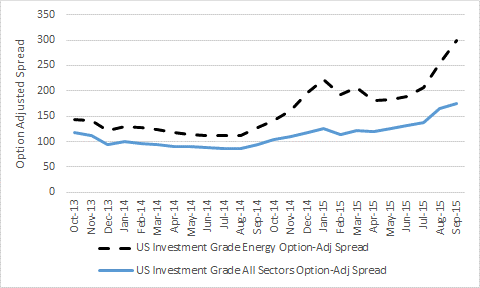
Exhibit 4: Investment Grade Corporate Option-Adjusted Spreads Comparing the Energy Sector Versus All Sectors (Source: Bloomberg FICM)
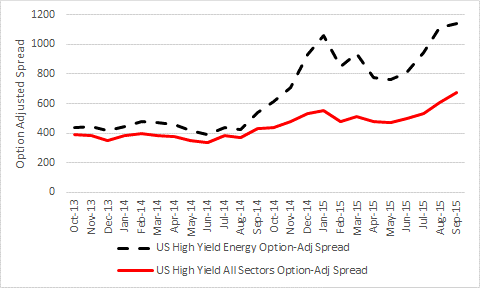
(Data through 9/30/2015)
Finally, MLP investors have been hurt to the tune of -25.94% loss YTD through 10/20/2015 (S&P MLP Index).
