On Monday, Aug. 24, 2015, the global stock market tumbled, with the Dow Jones Industrial Average® losing 1,000 points in seconds. We have seen similar turbulence in the equity markets in 1987, 1997, 1998, 2007, and 2008.
We know that the stock market is an important leading indicator, as it reports on the health of companies’ earnings estimates and the health of the global economy. Housing prices can also be considered leading indicators, as a decline in housing prices can be representative of excess supply and inflated prices.
The S&P/Case-Shiller Home Price Indices use the repeat sales methodology, which has the benefit of directly measuring changes in home prices by only including homes that have been sold twice. The indices are calculated monthly, using a three-month moving average. Index levels are published with a two-month lag.
I want to use this post to see if the sharp declines in equity prices (using the S&P 500® ) are reflected in the S&P/Case-Shiller Home Price Indices, and, if so, in what time frame and at what magnitude? The dates evaluated are depicted in Exhibit 1.
Exhibit 2 charts the levels of the S&P 500 against the levels of the S&P/Case-Shiller U.S. National Home Price Index.
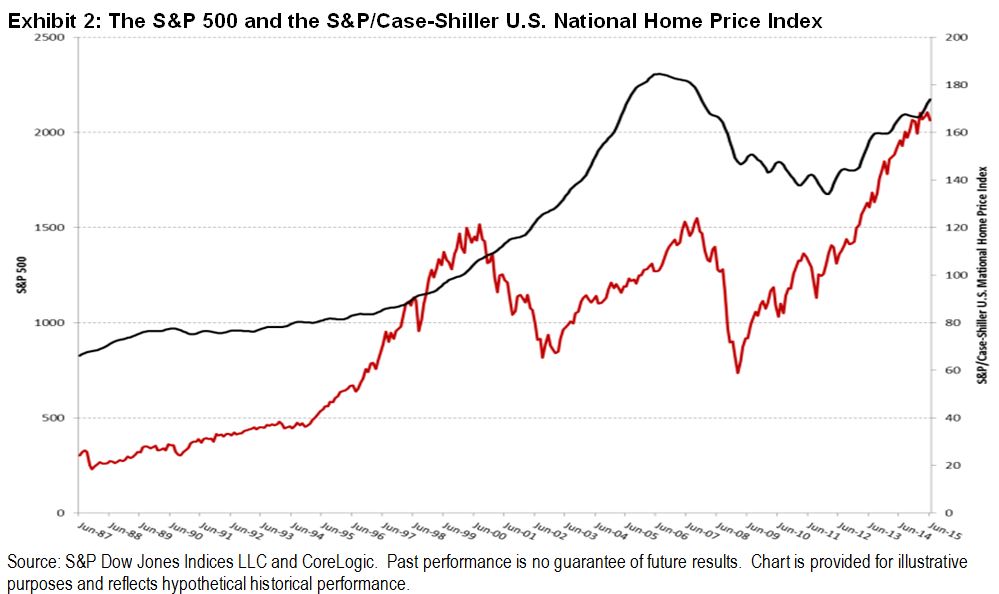
While the indices moved in the same general direction, one clear difference was that the volatility in the equity market was not reflected in the housing market. The next step was to drill into the returns near the dates of the previous stock market crashes presented in Exhibit 1.
