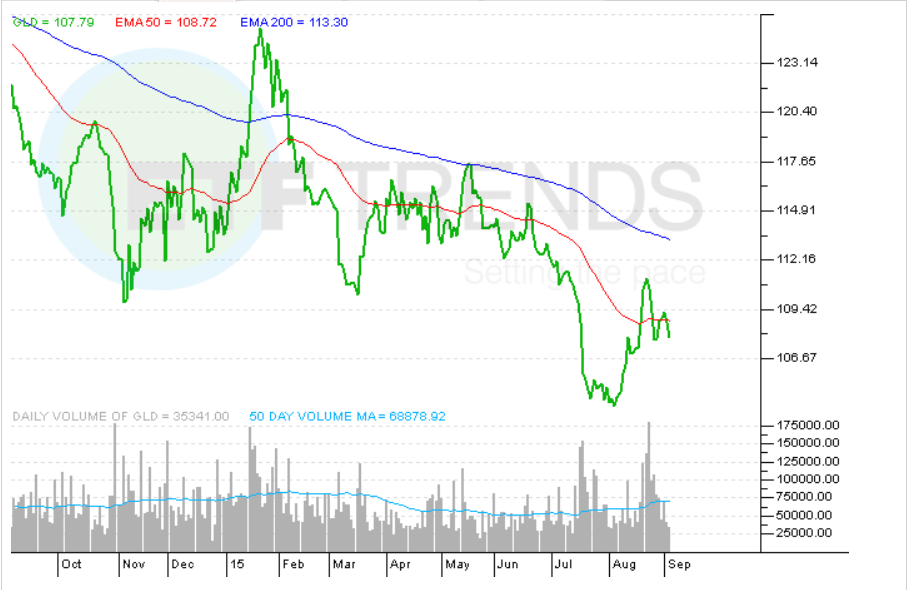
Turning to the 3-month continuation chart, we see that Gold is now trading under both the 20- and 50-day Simple Moving Averages (SMA). The 20-day SMA is still above the 50-day SMA, a bullish sign. Traders will be looking to see if the recent down days for Gold will cause the 20-day SMA to again cross below the 50-day SMA. The 14-day Relative Strength Index is in oversold territory at 25.7. Support is found at the 1075 level, which is not too far from the important psychological level of 1000,” according to OptionsExpress.
SPDR Gold Shares
Tom Lydon’s clients own shares of GLD.
