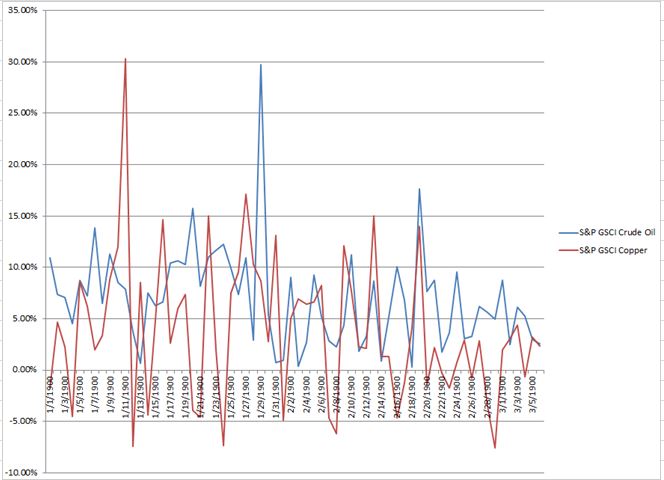
Below is an actual example between WTI (blue) and unleaded gasoline (yellow) where the magnitude of average increases are almost exact, yet the correlation is only 0.6. Out of 66 positive WTI oil months in the past 10 years, there were only 10 months where unleaded gas dropped, showing it is difficult for gas to fall when oil rises.
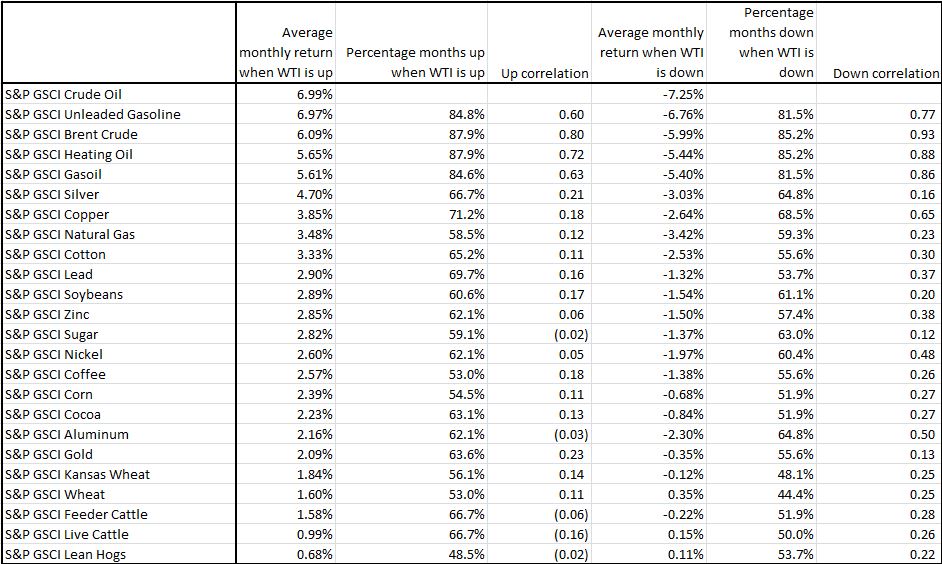
Let’s pick copper as a different example. It has very low correlation of 0.18 to oil when oil is rising. However, it on average had a monthly return of 3.85% when oil was positive and returned positive in 71% or in 47/66 of those months. Copper generally was pulled up with oil, just at various magnitudes, making the correlation low.
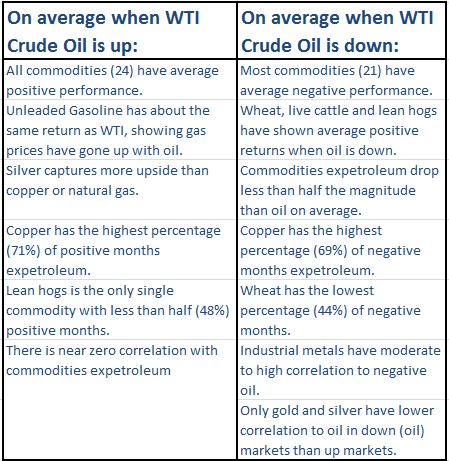
Below are some highlights of commodity relationships to oil as oil prices rise and fall.
This article was written by Jodie Gunzberg, global head of commodities, S&P Down Jones Indices.
© S&P Dow Jones Indices LLC 2013. Indexology® is a trademark of S&P Dow Jones Indices LLC (SPDJI). S&P® is a trademark of Standard & Poor’s Financial Services LLC and Dow Jones® is a trademark of Dow Jones Trademark Holdings LLC, and those marks have been licensed to SPDJI. This material is reproduced with the prior written consent of SPDJI. For more information on SPDJI, visit http://www.spdji.com