Firming the long case for EFZ is that EFA and VEA are trading at their lowest levels since the third quarter of 2013. EFA and VEA each reside more than 8% below their 200-day simple moving averages.
This is how bad things have gotten for ex-U.S. developed market equities against the S&P 500: A ratio measuring the MSCI EAFE Index, EFA’s underlying index, against the benchmark U.S. index hovers near its worst levels in four and a half decades. [International ETFs Lag U.S. Rivals]
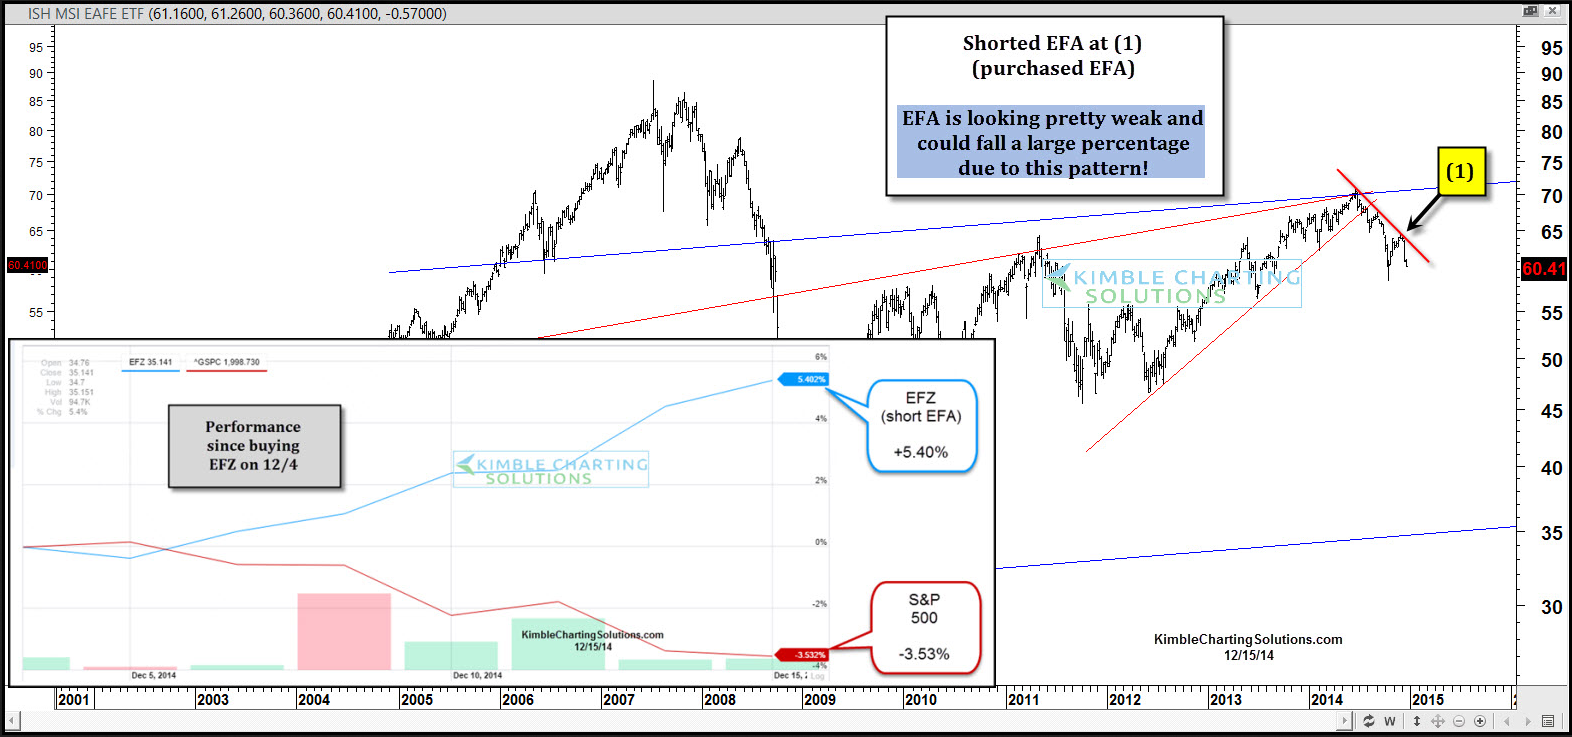
EFA, EFZ Charts
Chart Courtesy: Kimble Charting Solutions
Tom Lydon’s clients own shares of EFA.
