“It may be time for the Oil Servicing names to take the lead and drive higher against Oil itself again. When I look at the weekly chart of the ratio of the two ETF’s that measure OIH and the United States Oil Fund (NYSEArca: USO) below it has positive signs for this development,” notes Greg Harmon of Dragonfly Capital.
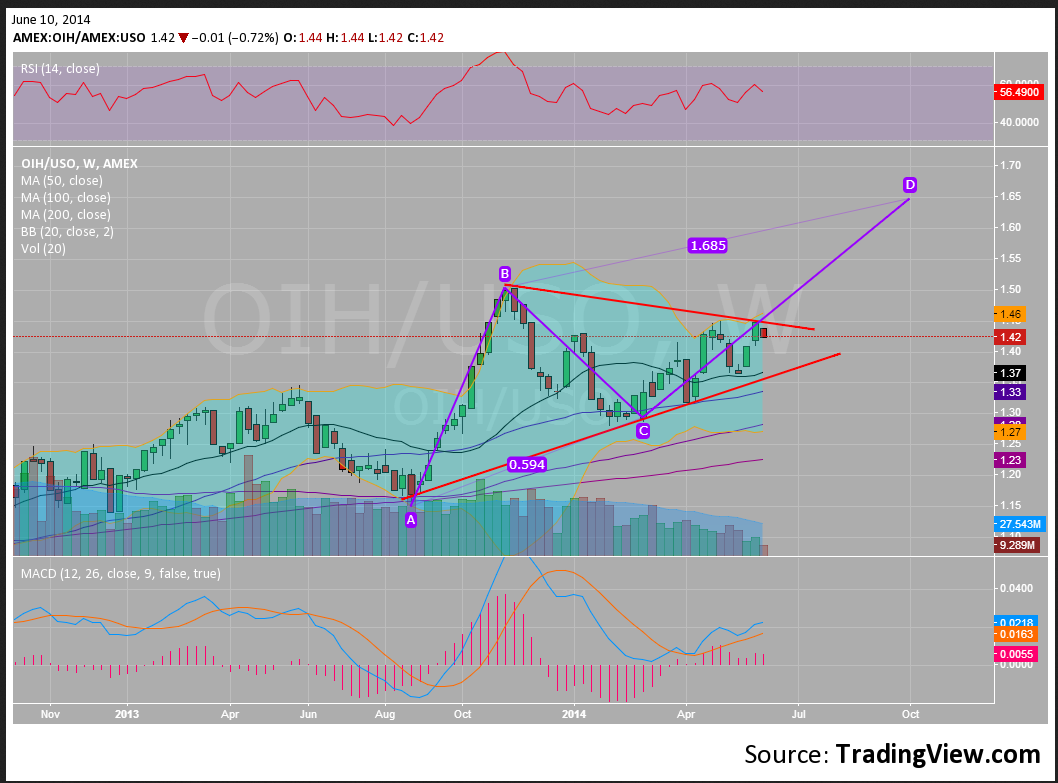
“The symmetrical triangle that it is currently trading in is not one of them. But should it break the triangle to the upside it would carry a target of 1.80 on the ratio. That is a big move. The signs that suggest you watch it closely come from a close examination of the candles themselves. The AB=CD pattern tracing out suggests a continuation to 1.65 at least and a 138.2% extension of the AB leg would take it near the 1.80 target. The price action since the ‘C’ point is also positive with a series of higher highs and higher lows. And the momentum indicators RSI and MACD are both positives and rising.”
OIH/USO Weekly Ratio Chart
Chart Courtesy: Dragonfly Capital