Since 1995, there have been 8 positive January months with an average return of 9.1%. The highest return in January was in 2007, when the S&P GSCI Natural Gas returned 21.7%. Although there was a slightly positive return in 2008 of 34 basis points, 2014 has the first significant positive return since 2008, 6 years ago, when the monthly return was 7.9%. Please see the chart below:
Source: S&P Dow Jones Indices. Data from Jan 1995 to Jan 2014. Past performance is not an indication of future results. This chart reflects hypothetical historical performance. Please see the Performance Disclosure at the end of this document for more information regarding the inherent limitations associated with backtested performance.
The question is what has happened following a positive January for natural gas? In years with positive January months, average first quarter returns were 14.7% for the spot index and 18.7% for the total return. Average annual returns were 49.9% for spot natural gas and 38.5% for the total return, but without the crisis years, the average annual return was double.
Please see the table below:
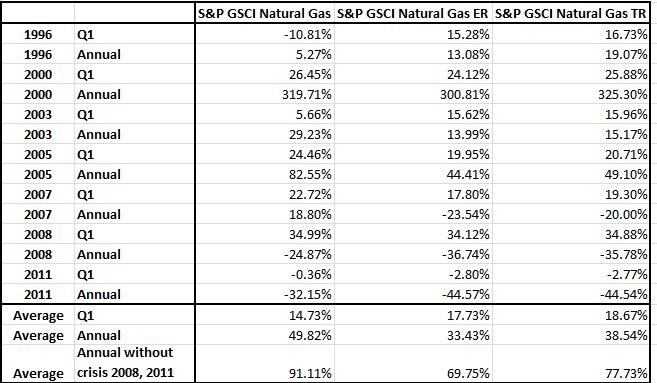
Source: S&P Dow Jones Indices. Data from Jan 1995 to Jan 2014. Past performance is not an indication of future results. This chart reflects hypothetical historical performance. Please see the Performance Disclosure at the end of this document for more information regarding the inherent limitations associated with backtested performance.
About Jodie Gunzberg
Jodie M. Gunzberg is vice president at S&P Dow Jones Indices. Jodie is responsible for the product management of S&P DJI Commodity Indices, which include the S&P GSCI® and DJ-UBS Commodities Index, the most widely recognized commodity benchmarks in the world. Both indices represent the global commodity market and are most commonly used for the historical benefits of inflation protection and diversification to stocks and bonds.
© S&P Dow Jones Indices LLC 2013. Indexology® is a trademark of S&P Dow Jones Indices LLC (SPDJI). S&P® is a trademark of Standard & Poor’s Financial Services LLC and Dow Jones® is a trademark of Dow Jones Trademark Holdings LLC, and those marks have been licensed to SPDJI. This material is reproduced with the prior written consent of SPDJI. For more information on SPDJI, visit http://www.spdji.com.