Things are different this time . . .
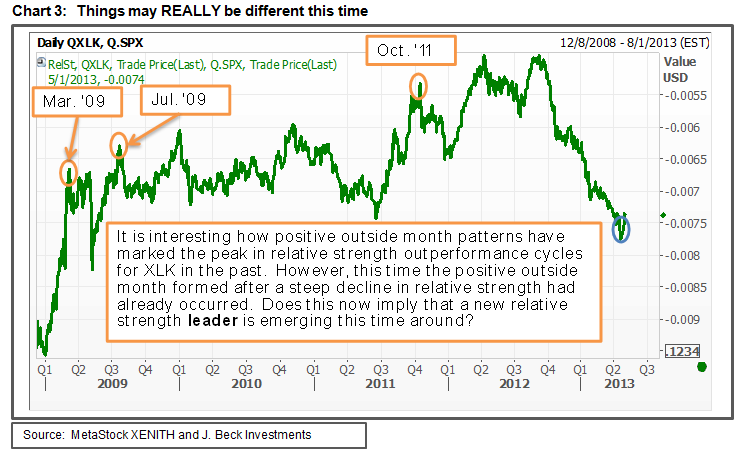
Contrary to what one might initially expect, it is interesting how positive outside month patterns have actually marked the peak in relative strength outperformance cycles for XLK in the past. However, the positive outside month patterns that developed in March/July 2009 and October 2010 had already benefitted from sharp climbs in relative strength. As such, money began to rotate into other sectors of the market (like Financials, Consumer Discretionary, and Industrials sectors) that previously underperformed as investors sought out alpha. This all happened as XLK continued to rally in absolute terms, which turned out to be healthy for the stock market as a whole.
This time around things might be different as the April 2013 positive outside month pattern formed after a steep decline in relative strength had already occurred. The relative strength breakout in Chart 1 suggests that quite the opposite might be happening now as technology could be setting the stage to outperform its sector peers. In the case of a sharp reversal it would take a move back below the April 2013 breakout to alter this view.
There is still one major hurdle to overcome
A complete analysis should not be done with relative strength charts alone. If this were done then one would have overlooked this large head and shoulders top pattern that still needs to be dealt with. XLK might still need to push through the head, or the September 2012 high, in order to negate this pattern. Until then, a foreboding distribution pattern needs to be considered because it could have far reaching consequences.

There could be ripple effect through the S&P 500
Despite the fact that technology (via XLK) appears to be turning into a leadership sector, there are a couple of broader market implications that need to be monitored, both are based on the assumption that the technology sector continues to relatively outperform and the eventual outcome of this head and shoulders top pattern.
One consideration is that the negation of this bearish pattern coupled with continued relative leadership would have bullish implications for the stock market as a whole since the technology sector remains the most heavily weighted in the S&P 500 (17.5%). Relative and absolute strength from the largest sector could go a long way to pull the rest of the market higher.
On the other hand, if technology remains a relative strength leadership sector and this head and shoulders top pattern is not negated, then this could spell big trouble for the stock market. Think about it this way: if the largest sector is emerging as a relative strength leader at the same time as a large head and shoulder top is forming, then this would be bad news for other sectors and the market at a whole as it implies that money is fleeing domestic equities (via S&P 500) rather than rotating within it. This scenario would culminate in a major market peak.
The stock market does not make things easy, so continue to watch technology, because this may hold the key to how and when this cyclical bull market comes to an end.
J. Beck Investments is an independent provider of technical research for ETFs.
