Emerging market stocks have become a standard part of most sophisticated investors’ portfolios, but emerging market fixed income investments have been much less common.
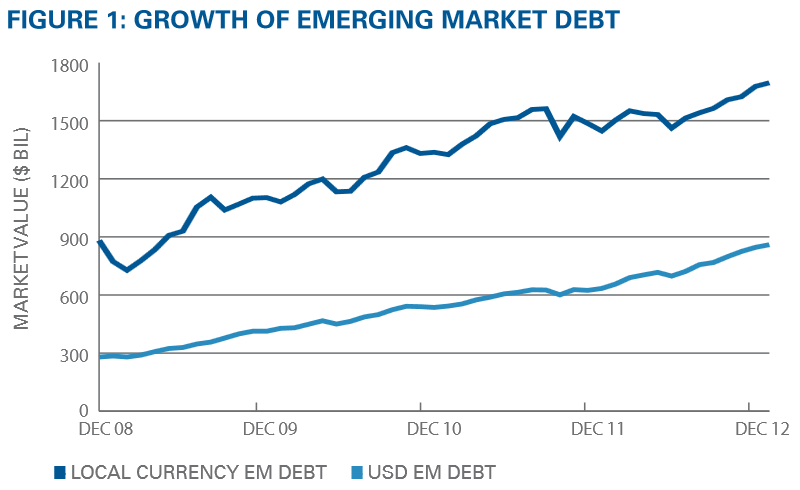
Today, 12% of the world’s equity market capitalization is in the emerging markets. Consider that local currency emerging market debt as of December 31, 2012 was north of $1.8 trillion, up more than 96% since the beginning of 2008. As these countries’ economic, currency, and market characteristics strengthen, investors may benefit from local-currency exposure to emerging market debt.
The case for investing in local-currency emerging market debt rests on:
- Opportunity to benefit from emerging markets’ economic growth and creditworthiness
- Diversification
- Higher yields
- Returns from foreign currency appreciation
EVOLUTION OF EMERGING MARKET LOCAL-CURRENCY DEBT
Emerging market countries are progressing toward becoming developed countries in terms of their financial institutions. Thanks to ongoing issuance of debt and market liberalization, these countries’ debt markets have evolved significantly since Americans first noticed emerging market debt around 1989-1990 when dollar-denominated Latin American debt was issued in the wake of loan defaults.
For a long time, debt issued in dollars or other developed market currencies dominated emerging market debt issuance. Today emerging market governments prefer to issue debt denominated in their local currency. As a result, the value of local-currency debt exceeds that of dollar-denominated debt. This is partly due to demand from wealthier citizens and pensions in the countries of issuance. In addition, increased liquidity and access has attracted foreign investors looking to capitalize on the growth and diversification benefits of this developing asset class.
Issuance of emerging market local-currency debt has grown dramatically. For example, it grew by more than 96%—going from 918 billion to $1.8 trillion—over the four-year period ended December 31, 2012. Rising investor interest in emerging markets means this trend is likely to continue. Along with that growth comes increased liquidity, which enables access from domestic and international investors alike. This expansion has also fostered the development of both active and passive investment strategies for emerging market local-currency debt.
Source: Morgan Markets, Barclays Live, SSgA, as of 12/31/2012
Emerging market countries’ balance sheets have also improved. Many hold substantial reserves and are rich in natural resources. In addition, their manufacturing and export-driven economies support increasingly robust employment and consumer spending.
Some emerging market governments may be more creditworthy than their developed market counterparts, which face large public deficits, debt burdens, and unemployment. Europe’s sovereign debt crisis showed that developed market bonds pose risks, too. Some emerging market countries’ debt-to-GDP ratios are much more attractive than those of developed countries (Figure 2).

Source: IMF, World Economic Outlook Database, September 2011 (2015 data are projections).
The Above projections are estimates based on certain assumptions and analysis made by SSgA. There is no guarantee that the estimates will be achieved.

Source: JP Morgan, S&P®, Barclays, Dow Jones, Zephyr StyleADVISOR, SSgA, as of 12/31/2012.
The correlation coefficient measures the degree to which the movements of two variables are related. For example, a correlation of 1.00 (or 100%) would indicate that the two asset classes monthly returns move in the same direction (positive or negative) for the stated time period. In contrast, a correlation coefficient of -1.00 would mean that the to indices move in opposite direction. A correlation of zero indicates that the two exhibit no discernible relationship.
LOCAL-CURRENCY EMERGING MARKET DEBT—BENEFITS FOR US INVESTORS
DIVERSIFICATION
Investing in local-currency emerging market debt offers the potential for a better tradeoff between risk and return. Historically it has had relatively low correlations with more traditional asset classes. For example, it showed a correlation of 0.41 with the Barclays Aggregate Index over the period from 2008 to 2012 (Figure 3). Its correlation with emerging market stocks was 0.84 over the same period. However, diversification does not ensure a profit or guarantee against loss.
