Tactical yield follows different principles that adjust for fluctuations in security level risk composition changes. Following tactical approaches to asset allocation, a defensive posture is needed to maintain quality in between pre-set evaluation periods in passive indexes. These processes will cast out securities that fall below the quality profile of the index on a monthly basis – if possible. This minimizes unwanted systematic risks associated with changes in the fundamental makeup of the index. For example, the index enhancement mitigates risks of companies that have negatively changed their dividend policy and fixed income with changes in their credit ratings.
Investment discipline is another advent of tactical asset allocation. It is therefore important to regularly index harvest gains and rebalance back to equal weight. This is central to the value of such an index, and captures gains and preserves the diversified profile of the index. Additionally, the entire index should be re-constituted annually based on its yield screen parameters. This process, conducted across the entire global securities database, sets the target outlook for the upcoming year.
Fixed income exposures can vary greatly. Weighting securities in a basket differently makes a distinction to traditional bond exposures. Large, concentrated exposures are more susceptible to inflationary price trends. Traditional bond exposures are all issuer-weighted, with a heavy concentration on bigger issuers. Their exposures aim for simple perpetual income with yields eroding faster during inflationary prices. Equally weighted thematic exposures across high yield, emerging markets, Latin American and European sovereign bond exposures target growth segments by first running a yield screen and then equally weighing the top yielders. The alternative equally weighting scheme diversifies concentration risk.
Equally Weighting Yield
Equal weight, with its inherent maximum exposures, addresses concentration. This could find a good resting place with our multi-asset diversification as part of a relative risk-off environment. Combining quality dividend/interest-paying securities into equal weight cycles deems that investors flock to quality after risk (Q2 of 2009 is a prime example), and allocate to it as a satellite of the portfolio.
Annual yield screens can sort based on yields. It is critical that the companies meet the quality, liquidity and qualitative screens. The best performance series of the index can be explained by movements in the underlying equity indexes. The upside/downside capture works as a hedge for market fluctuations as well as a smart alpha play.
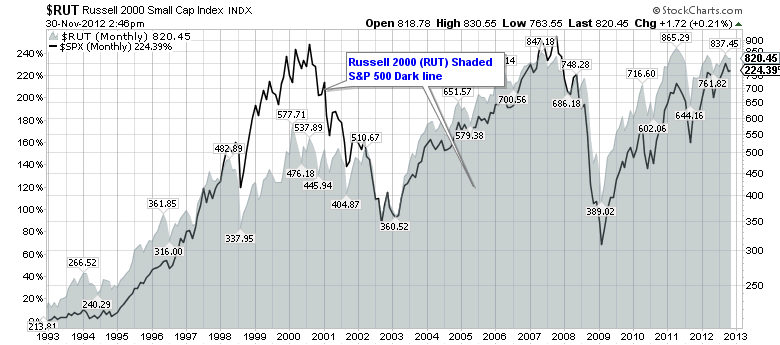
As trading efficiencies are gained, costs associated with portfolio turnover are not as impactful as once portrayed. Throughout the decades, numerous academics and money management industry trackers have cited studies that clearly outline the risk/reward opportunities available in small capitalization and emerging markets. Figure 6 illustrates the outperformance based on the capitalization of the Russell 2000 vs. S&P 500 from 2000 to 2012, when many of the efficiencies were gained.
Figure 6: Index Comparison (Russell 2000 Small Cap vs. S&P 500 Large Cap)
From a different perspective, the evolution of indexes has impacted the ability to access yield. It is clear that as indexes have evolved, first broad-based coverage was developed, and with the advent of the capital market asset pricing model, more specialized tracking and products have evolved. Implementing asset allocation strategically with passive indexes, style, factors, overlays and now tactical approaches with smarter exposures have clearly become the next chapter.
Equally weighting indexes and tracking products such as ETFs is a smart way to remove market capitalization biases and gain access to small cap or at least smaller-capitalization constituents in traditional indexes. Figures 6and 7 illustrate the outperformance of the S&P 500 Equal Weight by the Russell 2000 due to market capitalization. Figures 7 and 8 show the Russell 2000 market capitalization weighted index and the Russell 2000 equal weight.
Figure 7: Russell 2000 Market Cap and the Russell 2000 Equal Weight (Data Source: Bloomberg and FactSet):

Taking the yield based on market capitalization further, Figures 8 and 9 show the S&P 100 and the S&P 500 Index market capitalization vs. equal weight.
Figure 8: S&P 100 from (Data Source: Bloomberg and FactSet)

Figure 9: S&P 500 from (S&P/DJ Indexes)

Source: Factset and Bloomberg
Ranking by Top-Down by Yield:
Moreover, in order to select top candidates for an income-generating index, a number of criteria can be used for the selection process: stated distribution policy, last distribution, ability to continue to pay distributions, certainly history of distribution and coupon rates for debt issued bonds. These data points can all be tracked via a repeatable database of routine index providers. The industry has seen a number of innovations in ways fundamental attributes are used to assess better candidates. Utilizing the highest-yielding screen for securities is a new innovation since it is inherently a multi-variant approach. If the screen is conducted on an already qualified securities database that is liquid with all of the distribution history, then the screen exposes a true value bias. Once this list is equally weighted, then dynamics of systematic reward is coupled with underpriced high-yielding securities.
————————————-
About the Authors: Ray Amani is Director of Product Development at Arrow Investment Advisors, LLC. Joe Cunningham is Director of Capital of Markets at Arrow Investment Advisors, LLC. For more information, visit: www.arrowshares.com and www.arrowfunds.com.
The opinions expressed herein are solely those of the author(s), and may or may not actually come to pass, and should not be used or construed as an offer to sell, a solicitation of an offer to buy, or a recommendation for any product.
