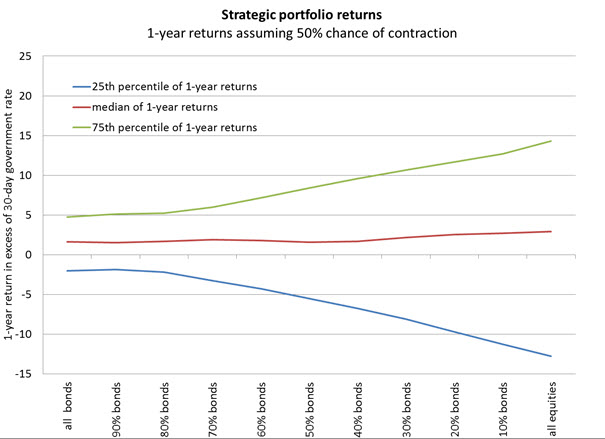
What about investors who think the probability of a cliff-induced recession is higher than normal? The chart below shows what happens if the probability of a cliff-induced economic contraction is set at 50% instead of 15%[3], as Russ Koesterich has argued recently.
The chart suggests that even for aggressive investors there is little reason to have a large allocation to equities if you believe there is a higher-than-normal chance of a recession. The chart shows that holding more equities would not be expected produce returns that are materially better than a conservative allocation. In addition, the size of the potential downside also increases across the board – in other words, an investor is not likely to be rewarded for taking on additional risk.
The upshot of this analysis? Investors do not need to have high conviction that cliff-induced recession will take place next year to consider some reallocation in their portfolios. History suggests that an even 50/50 chance of recession in the next 12-month (compared to the 15% normal chance) can have a material impact on the typical 1-year returns associated with a simple bond/equities allocation. As we have argued in the past investors concerned about heightened volatility on the back of longer-term macroeconomic concerns — including a cliff-induced recession — should consider some reallocation toward dividend-paying equities as well as managed volatility portfolios.
[1] Stock return data is from Fama-French, reflective of the return of the total U.S. stock market as commonly used in academic research. The 30-day government rate (or “risk free” rate) is also from Fama-French. Return data for bonds is from the IA SSBI database, computed as a combination of corporate bond total returns (weighted at 33%) and intermediate government bond returns (weighted at 64%).
[2] I used the standard NBER classification of U.S. economic cycles to classify every month in the 1926-2012 period as either in contraction or expansion.
[3] This chart is constructed in the same way as the first chart, except that periods of economic contraction (i.e. 1 year periods with at least 3 months classified as contraction) are weighted so as to account for a 50/50 chance of occurrence.
Daniel Morillo, PhD, is the iShares Head of Investment Research.
