With the presidential election now over, it’s time for investors to consider what the looming fiscal cliff could mean for asset allocation in 2013. While no one can predict the future, I don’t expect next year to be characterized by a “normal” investing environment that is well suited for a typical strategic allocation strategy.
Instead, 2013 offers two very distinct scenarios. First, there is the possibility of a fiscal cliff-induced recession. Second, there is the possibility of continuing gains in equities if the cliff is avoided and the US economy continues on its recovery path.
How should an investor approach asset allocation given the uncertain outlook? I’d recommend taking into account the different probabilities of 2013 experiencing a cliff-induced recession.
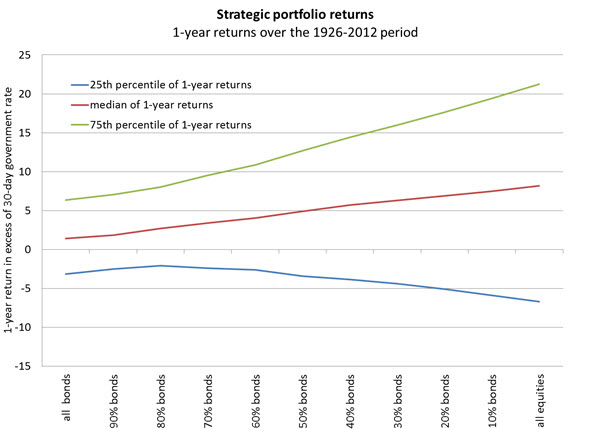
To do that, let’s construct a portfolio that is a mix of stocks and bonds to be held over the next year. Then, let’s look at the range of possible return outcomes if next year turns out to be a “typical year”. I have taken monthly return data (in excess of the 30-day government yield) for the U.S. stock market and the U.S. bond market since 1926[1], and I’ve computed the 12-month returns of simple bond/stock portfolios for all possible 12-month periods since 1926. The results are summarized in the three lines in this chart: the typical return, the potential upside return (defined as 75th percentile of return outcomes) and the potential downside return (defined as the 25th percentile of return outcomes):
The horizontal axis shows the percentage allocated to bonds and the vertical axis shows the typical 1-year returns of these portfolios over the last 85 years. The chart confirms what could be considered standard intuition: Taking a higher allocation in equities produces higher returns, as shown by the median return line. But it also produces a wider range of returns, as indicated by the 25th and 75th percentile lines, which is reflective of the increased risk that a higher allocation to equities produces.
Now, what would happen if the United States went over the cliff in 2013, creating negative economic growth through part of the year? To answer that, let’s look at what happens to the returns of a typical portfolio that experiences an economic contraction in the year after the simple bond/stock portfolio has been constructed[2]. Data from the1926-2012 period shows that if a portfolio is constructed at the end of a month that is not already classified as an economic contraction then the probability that there will be at least one quarter of negative growth over the following 12 months is about 15%. In other words, investors who think that the probability of a fiscal cliff-induced economic contraction in 2013 is the same as the “normal” 15% probability of contraction can use the chart above as a guide for simple allocation.
