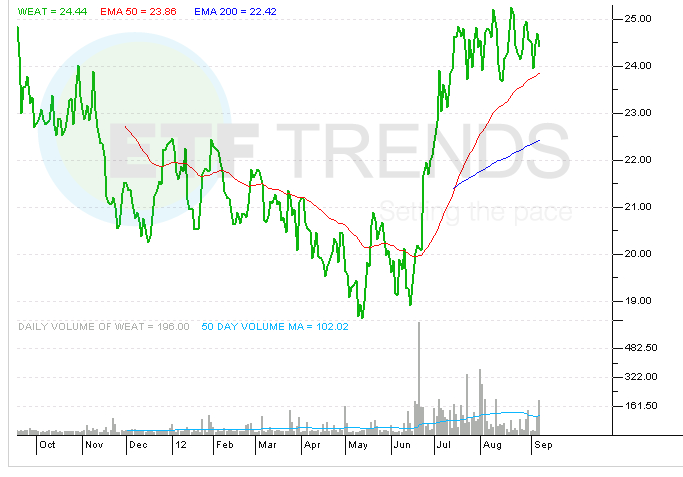
Having retraced a few times recently, the fund seems to be finding some technical support on its 50 day moving average, and the 200 day moving average (being a relatively newer fund to the landscape) is also now an observable metric ($21.62) and WEAT is trading significantly higher than this level as of yesterday’s close.
Teucrium Wheat Fund
For more information on Street One ETF research and ETF trade execution/liquidity services, contact Paul Weisbruch at [email protected].