However, those in the bull camp will say “look at the VIX,” and they will note quickly that the index fell on Friday, despite the pullback in equities, and it remains squarely below both its 200 and 50 day moving averages, and it continues to have a handle in the $16-$18 range.
Unfortunately or fortunately, as it truly depends on how, as an institutional portfolio manager you are currently positioned (long or short equities), daily market movements in either direction remain highly dependent on coordinated headlines and even off the cuff, impromptu remarks from European leaders. Similarly, there is plenty of talk currently about “invisible hand” type intervention that has been entering the markets from a variety of areas around the world, not limited to the U.S. and Europe, but now China has become very actively involved in such market-moving actions.
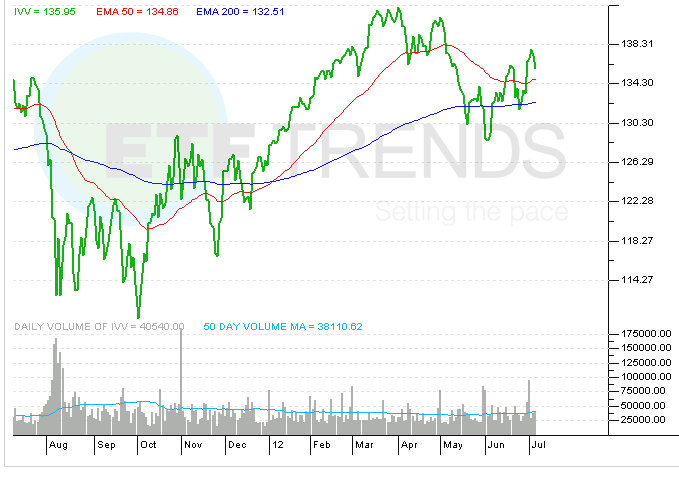
Fund flows, for the first time in recent recollection, demonstrated some serious conviction toward equities last week on the whole. For instance, fund leaders on the inflows side include SPY, QQQ, VWO (Vanguard Emerging Markets), IVV (iShares S&P 500), XLE (SPDR Energy), and IWM (iShares Russell 2000) for instance. Collectively, these ETFs reeled in $8 billion last week, with more than $5 billion of that flowing into SPY alone. Leveraged long ETFs were in play last week as well, which is not a weekly phenomenon by any stretch. UWM (ProShares Ultra Russell 2000) and SSO (ProShares Ultra S&P 500) both took in impressive asset flows last week, attracting more than $500 million collectively. We do not commonly see asset flows of these sizes in such funds on a regular basis, so it seems rather clear to us that an institutional player, or players, are using these leveraged long ETFs to gain upside exposure to both the Russell 2000 and the S&P 500 Indexes, in essence leveraging themselves to both long and small cap equities.
Where were assets flowing from last week? One needs to look no further than fixed income ETFs to see where the carnage occurred from a fund flows standpoint, as funds including SHY (iShares Barclays 1-3 Year Treasury Bond), IEI (iShares 3-7 Year Treasury Bond), UST (ProShares Ultra 7-10 Year Treasury) led the way on the redemptions side. Collectively, these three funds lost more than $2.3 billion in assets outstanding while other fixed income ETFs including TIP (iShares Barclays TIPS), AGG (iShares Barclays Aggregate Bond), TLT, and IEF (iShares Barclays 7-10 Year Treasury Bond) were also among the leaders in all ETFs last week in terms of redemption activity.
This coming week’s early action will be important, as market observers will want to see if the SPX can resume its forward momentum and not only challenge, but eventually eclipse recent highs and potentially work its way back to pre-May levels. Also, as we get closer to August, market participants whom remain scarred from last year’s brutal August to October period, may simply sit on the sidelines until more clarity is brought to the overall picture in Europe, which undoubtedly continues to influence global markets whether anyone likes it or not.
