In fact, bearish speculators have continued to surface in recent weeks here and there but continue to be “directionally wrong” in the big picture, as despite a few hiccups along the way, the longer term trend in Treasury Bond prices continues to be “up.”
Another ETF product in the 7-10 year U.S. Treasury bond category also saw significant inflows last week was ProShares Ultra 7-10 Year Treasury Bond (NYSEArca: UST).
UST tracks the same index as IEF, only the fund is designed to deliver two times the daily return of that index, and is used heavily by short term speculative traders and also aggressive hedgers. UST attracted nearly $500 million last week and ranked among the top five in all ETFs in terms of net creations.
We find the price action last week in Treasuries, coupled with the institutional creation activity to be very notable, especially given the steep and sudden equity meltdown. It is entirely possible that nervous institutions have suddenly bailed from equities and moved into “safer” U.S. Treasury bonds for the near term, and thus are using products such as IEF and UST until the smoke clears in the equity picture.
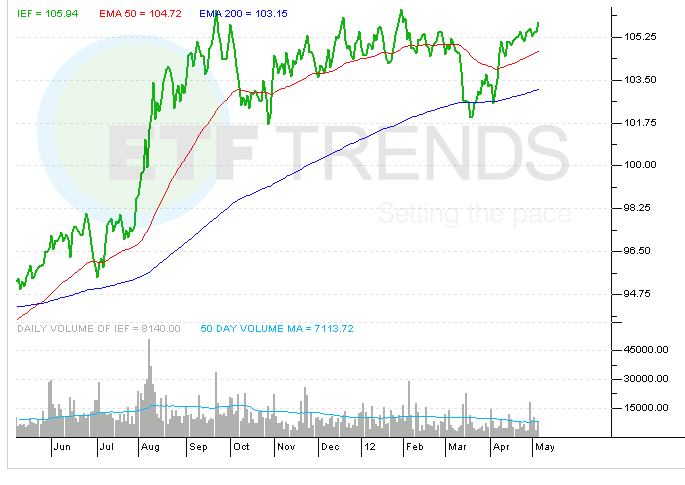
iShares Barclays 7-10 Year Treasury Bond
For more information on Street One ETF research and ETF trade execution/liquidity services, contact [email protected].