Earlier this week we witnessed an enormous uptick in trading volume in a thinly traded product, SPDR Barclays Aggregate Bond (NYSEArca: LAG), with more than 3 million shares trading on Monday versus average daily volume of about 97,000 shares.
Resulting from this activity, we have also seen more than $200 million enter the fund via creations, clearly demonstrating that this volume is net institutional buying. As its name suggests, LAG tracks the Barclays Capital U.S. Aggregate Bond Index, which is a broad measure of the U.S. investment grade bond market.
Other ETFs in the space include iShares Barclays Aggregate Bond (NYSEArca: AGG) which tracks the same index actually, but is a much larger fund in total assets (north of $14 billion currently in the fund) and it trades much more actively as well (>1 million shares exchange hands daily).
Vanguard Total Bond Market (NYSEArca: BND), which also tracks the Barclays Capital U.S. Aggregate Bond Index is currently slightly larger than AGG in terms of assets ($15.4 billion currently), and a newcomer in the space Schwab U.S. Aggregate Bond (NYSEArca: SCHZ) also exists.
With all of these products tracking the same underlying benchmarks, investors are likely to be conscious of a) the pricing of these funds in terms of expense ratios b) tracking to their stated benchmarks and the existence of any tracking error and c) live performance measures. Year to date, returns look like the following: LAG (+0.52%), BND (+0.26%), AGG (+0.26%), SCHZ (+0.15%), but in the trailing one year period AGG leads the pack, up 4.83% followed by LAG (+4.49%), BND (+4.34%), and SCHZ does not qualify since it only launched in July of last year.
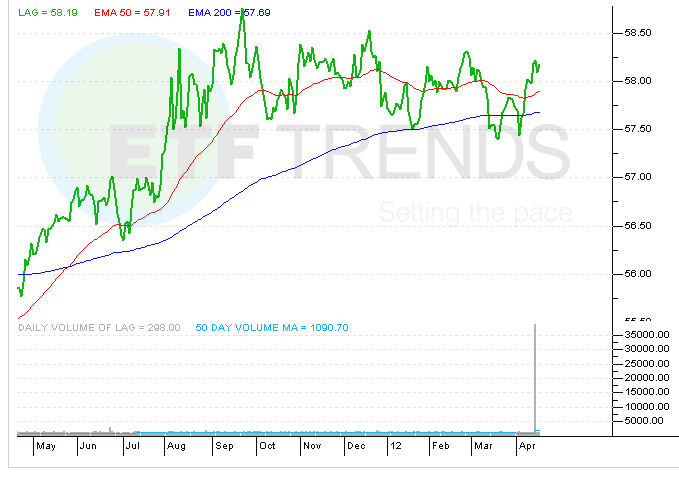
SPDR Barclays Aggregate Bond (NYSEArca: LAG)
For more information on Street One ETF research and ETF trade execution/liquidity services, contact [email protected].
