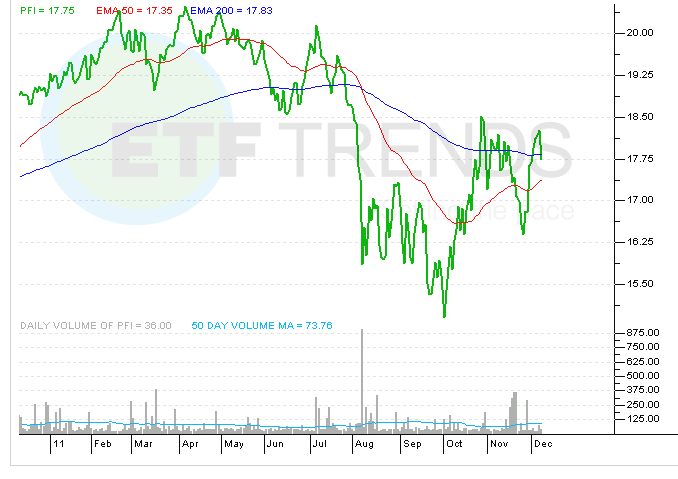
How have these various financials ETFs fared? PFI leads the pack year to date, down 6.25%, followed by FXO (-10.19%), IYF (-15.24%), RYF (-15.34%), VFH (-16.44%), and XLF (-18.30%).
Over longer periods of time, i.e. a 5 year time horizon, we see that the fundamental/quantitative screened approach in the financial sector is demonstrating the potential ability to beat the index benchmarks as well as PFI is down 30.35% and FXO has lost 34.56% while the benchmark itself, XLF, has lost 64.01%.
PowerShares Dynamic Financials
For more information on Street One ETF research and ETF trade execution/liquidity services, contact [email protected].
