One way to see if markets are in a “risk on” or “risk off” mindset is to look at the price action of the Russell 2000 ETF relative to the S&P 500 ETF. A rising price ratio means small-cap ETF is outperforming (up more, or down less on a relative basis) the S&P 500 fund. If that ratio is rising, it means investors are willing to take risk. If that ratio is falling, it means the opposite. [S&P 500 ETFs at 200-Day Average]
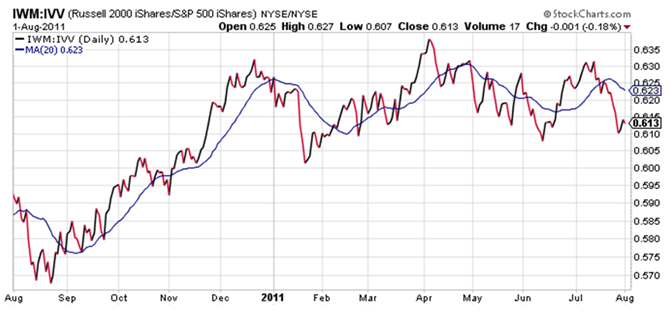
Chart source: StockCharts.com.
Let’s use the above chart as a real-time example. The price ratio bottomed right before September, when the QE2-infused equity rally was just about to get started.
However, the ratio has effectively gone nowhere for all of 2011. Much of this is due to the massive whipsaws that have occurred in all asset classes resulting from the continuous stream of “headline risk” markets have been dealing with this year.
The most recent break in the ratio which occurred sometime around the middle of July does seem to suggest that despite periodic moments of strength, the trend appears firmly lower for the ratio.
