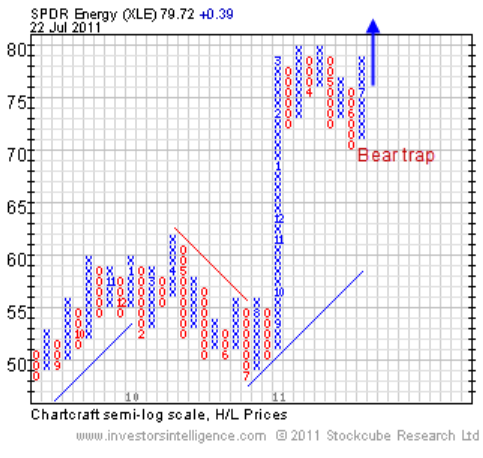
“Just as compelling is the P&F relative chart for XLE versus the S&P 500. That ratio exhibits a ‘W’ bottom, effectively a base which implies a relative move to the 2008 high, equating to further outperformance in the months ahead,” the newsletter said Friday.
Energy ETFs have been a sector leader over the past two weeks, according to StockCharts.


