“That implies uncertainty still persists and consequently the volatile range looks set to continue. That does not bode well for the U.S. markets as the two have been strongly correlated over recent weeks,” he added.
The euro ETF is currently giving mixed technical signals.
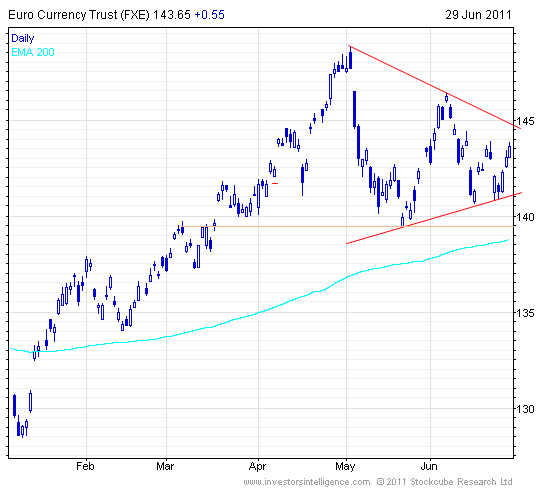
“The tightening range on the FXE chart is taking the form of a bullish triangle. However, the pattern could morph into a top formation on a break down through the May low of $139.44 [a share],” Coe said. “Basically direction is very much up in the air and given the current sensitivity to news flow, the fund is best avoided for the time being.”

Chart source: StockCharts.com.
