Technical indicators can be a useful tool for bond managers, particularly when combined with traditional fundamental/valuation methods and good old fashion macro research. In this piece, we address what the technical indicators are telling us about the potential path of the 10-Year Treasury yield.
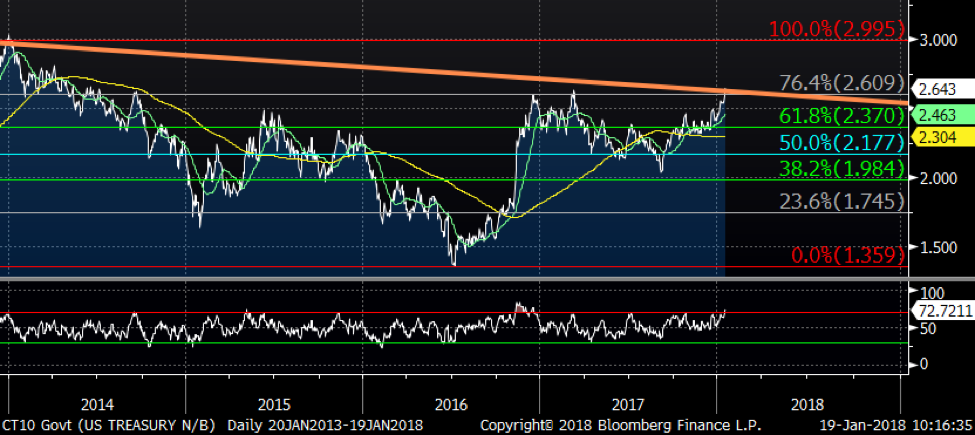
From a technical perspective, the 10-Year Treasury yield is testing the three-decade long secular bull market resistant trend line of 2.63%. Barring another false breakout, a break of 2.63% would put yields in a technical gap that could move yields up to a 3.00% very quickly. In this environment, diversification and active management are the keys to success for bond investors.
![]() The chart below illustrates that the long-term trend line of 2.63% (orange line) is close to intersecting the Fibonacci resistant level of around 2.61% (grey line). Fibonacci levels tend to be well respected support/resistant areas where a break-out occurs or serve as the proverbial line-in-sand that does not get crossed. Historically, once the trendline is broken though, a reversal pattern becomes a higher probability event.
The chart below illustrates that the long-term trend line of 2.63% (orange line) is close to intersecting the Fibonacci resistant level of around 2.61% (grey line). Fibonacci levels tend to be well respected support/resistant areas where a break-out occurs or serve as the proverbial line-in-sand that does not get crossed. Historically, once the trendline is broken though, a reversal pattern becomes a higher probability event.

Although a trend change in the 10-Year Treasury yield may sound frightening to bond investors, the technical charts provide a well contained, and range-bound, move in the 10-Year yield if the long-term resistant level is broken. If broken, the 3.00% level is not only supported, but also coincides with where the 5-year average real rate indicator suggests the 10-year rate should be.
As referenced in the chart below, although a sharp rise of the 10-Year Treasury has historically exhibited negative performance for the 10-Year Treasury, a well-diversified portfolio of bonds, as represented by the Barclays Aggregate Index, has performed quite well in those environments.

