
![]()
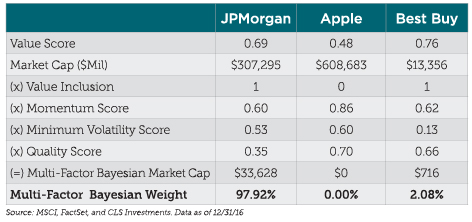
Sources: MSCI, FactSet, and CLS Investments. Data as of December 31, 2016
In the case of JPMorgan, the stock exhibits strong value characteristics and modest exposures to momentum and minimum volatility, but not quality. Best Buy has an even stronger score to value and modest tilts to momentum and quality, but not minimum volatility. Apple’s value score is less than 0.5, so it is not considered for inclusion in the final index (or simply put, the probability of Apple being considered a value stock is less than 50%).
In statistical terms, active managers are Bayesians at heart when it comes to selecting securities for their portfolios. The decision to choose stock A over stock B is conditioned first on a prior set of assumptions about each security (in this case, being a value stock). But, it is updated after additional information enables a more informed decision about which stocks to emphasize and avoid (finding value stocks that also exhibit momentum, minimum volatility, and quality characteristics).
This certainly presents the question as to whether multi-factor ETFs in their current form do capture the “essence” of a typical active manager’s process.
The Curious Case of Multi-Factor Index Methods in Practice
Now we will examine how well factor-mixing and factor-tilting compare to a Bayesian approach. To accomplish this, we will evaluate the annual holdings of the MSCI USA Index and construct each multi-factor index based on the appropriate methodologies highlighted above going back to December 31, 2003. Each index is constructed and rebalanced at the end of each year in December. From there, we will compare each portfolio to the MSCI USA Index and to each other on a risk-adjusted basis. We will also compare a version of the multi-factor Bayesian method where the multi-factor score of each stock is adjusted relative to the median market-cap of stocks in the MSCI USA Index instead of individual market-cap.
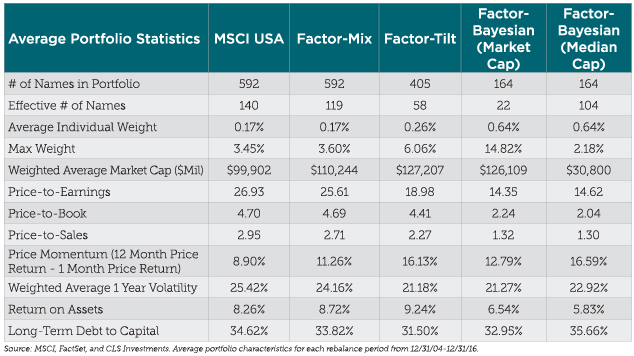
Sources: MSCI, FactSet, and CLS Investments. Average portfolio characteristics for each rebalance period from December 31, 2004 through December 31, 2016.
The results suggest all three multi-factor indices have reasonable exposures to each factor targeted. Generally, the multi-factor mix and multi-factor tilt methods generate average factor scores higher than those of the parent universe. In most respects, however, going from factor-mixing to-factor tilting yields greater amounts of excess tilt to each factor. The factor-Bayesian methods each respectively yields much higher tilts towards value than the two previously mentioned strategies. That is intended with the construction of these portfolios. What is unique is their factor scores are on par with other with the other strategies mentioned, except quality, which is the laggard.
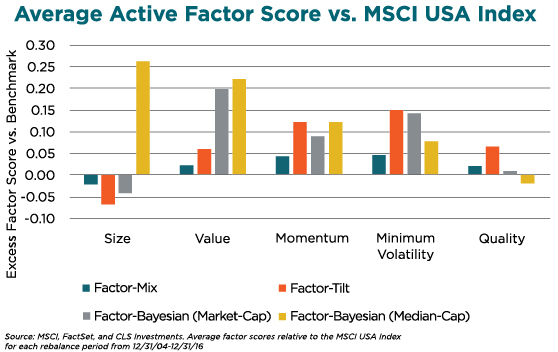
Sources: MSCI, FactSet, and CLS Investments. Average factor scores relative to the MSCI USA Index for each rebalance period from December 31, 2004 through December 31, 2016.
Regarding size exposure, the effects of weighting methods can be shown by applying each stock’s multi-factor score to either its own market-cap or another standard measure. These can yield different exposures to size as a factor. Should a multi-factor index or ETF have a bias to smaller companies as part of its delivery process or stay in line with the average market-cap of its parent index? Many index managers may argue that going up the cap spectrum helps ensure sufficient liquidity and capacity. However, active managers may argue that weighting securities by the greatest amount of available liquidity often reduces the opportunity since more market participants are efficiently pricing in prior information about the company. Hence, de-linking from a parent index can present opportunities that otherwise would have not been well-represented in the portfolio.
So, after all this work, which multi-factor method holds up best on a risk-adjusted basis? Our results show the most basic assumption about building multi-factor portfolios tends to hold. Combining factors that have been historically rewarded over time can help achieve an edge over the market. That result holds true for each multi-factor index strategy considered. The factor-mix method yields the lowest amount of risk-adjusted performance, followed by the factor-Bayesian method that is weighted based on market-cap. The factor-tilting and factor-Bayesian (based on median-cap) methods show the most promising results with nearly identical risk-adjusted performance.
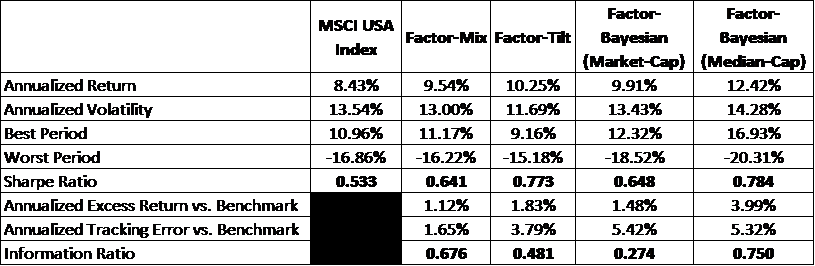
Sources: MSCI, FactSet, and CLS Investments. Investment performance of each strategy evaluated from December 31, 2003 through December 31, 2017.
In terms of assessing active returns, there is a stark difference in excess returns and tracking errors between the factor-tilting method and factor-Bayesian (median-cap) method. Although the factor-tilting method handily beats the benchmark, the amount of excess return per-unit of additional tracking error is far less in comparison to the factor-Bayesian (median-cap) method.
Despite the uptick in absolute volatility, the factor-Bayesian (median-cap) method still generates acceptable active results on an excess return and information ratio basis. We can also see the impact of de-linking from market-cap. The factor-Bayesian (median-cap) method generates an additional 2.51% in annualized excess performance relative to the performance profile of the factor-Bayesian (market-cap) method. Although one could argue that tapping into smaller companies will yield an additional premium, the process of selecting undervalued companies should naturally result in this type of behavior.
Key Takeaway – There is Still Room for Innovation in the Multi-Factor ETF Space
Multi-factor indices require further understanding of both their construction and the intention behind their methodologies. Combining factors in a single investment strategy can be a powerful way to achieve what many investors and advisors want in a fee-compressed world: capturing active-like returns within their beta. Such an endeavor can result in meaningful cost savings and more consistency over time if done right.
In our studies, we demonstrated that current multi-factor construction methods may be sufficient in moving towards that goal, but a Bayesian method of identifying stocks to own based on one set of factors and reconditioning based on additional factors that active managers utilize can be more true to the intentions of multi-factor indices. We also showed the ability to de-link a multi-factor index from each company’s individual market-cap can enable the index to capture additional excess return over time on a risk-adjusted basis by better emphasizing other securities that score well for inclusion in a multi-factor index. Over time, we believe such methods will become more mainstream among index providers and ETF manufacturers alike and can ensure future products look more in common with their active management counterparts.
Joe Smith, CFA, is a Senior Market Strategist at CLS Investments, a participant in the ETF Strategist Channel.
Disclosure Information
This information is prepared for general information only. Information contained herein is derived from sources we believe to be reliable, however, we do not represent that this information is complete or accurate and it should not be relied upon as such. All opinions expressed herein are subject to change without notice. The graphs and charts contained in this work are for informational purposes only. No graph or chart should be regarded as a guide to investing. 1123-CLS-1/19/2018
