By Derek Horstmeyer, Reina Tran, and Tao Wei
Often investors look at covered call strategies and wonder, is this the alpha generating strategy that I need to add to my portfolio? Now, investors don’t even have to construct covered call strategies all on their own – multiple ETFs have popped up in the last decade that create and roll over the strategy for an investor using call options on the S&P 500, NASDAQ 100, and Russell 2000.
With this in mind, we decided to look at how these covered call ETFs have performed over the past eight years (since the inception of the first covered call ETF available to the US public). We examined the full set of such ETFs available and then examined the median returns, volatility, Sharpe ratios and correlation with other assets. At a basic level the results are clear – covered call ETFs fail on a risk adjusted basis to beat large cap equity strategies and offer little in diversification benefits.
First, it is worth detailing what exactly is going on behind the scenes with respect to these covered call ETFs. A covered call strategy is constructed by holding a long position in a stock and then selling call options on that same asset, representing the same size as the underlying long position. This will limit the upside payout but also expose the investor to the downside should the stock fall in price.
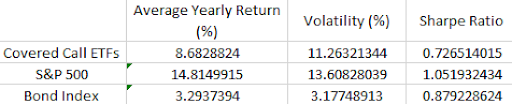
Turning to the results, covered call ETFs underperformed across the board. Covered call ETFs averaged a return of 8.68% per annum, while the S&P 500 average a 14.81% return over the same time period. Covered calls had a volatility of 11.26%, while the S&P 500 just had a slightly higher volatility of 13.61%. Putting these two figures together, we see that the Sharpe ratio of the covered call ETFs averaged 0.73, while the S&P 500 averaged 1.05. Even when we compare the average covered call ETF to our bond index fund it underperforms on a risk adjusted basis (bond index fund had a Sharpe ratio of 0.88).
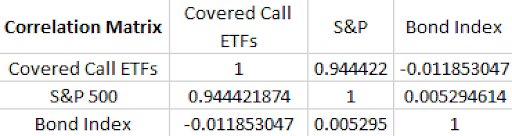
While they underperform on a risk adjusted basis, perhaps they help in terms of diversification. Examining the correlation coefficient between the averaged covered call ETF and the S&P 500, we get 0.94. This highlights that adding a covered call ETF to your all equity portfolio really doesn’t do much in terms of adding diversification.
Next, we decided to look at how covered call ETFs did over different interest rate environments. Perhaps covered call ETFs do better over decreasing interest rate environments as compared to rising interest rate environments. To test this idea, we separated our returns into three categories: increasing interest rate periods, stable interest rate periods, and decreasing interesting rate periods (using the Fed funds rate to define periods). Unfortunately, covered call ETFs did not have any meaningful better returns in any of these periods as compared to the S&P 500.
| Median returns (monthly) | Rising interest rate | Neutral interest rate | Falling interest rate |
| Covered Call ETFs | 1.33 | 1.75 | 1.20 |
| S&P | 1.65 | 1.91 | 1.65 |
| Bond Fund | 0.24 | 0.14 | 0.27 |
Finally, we examined the crash risk of the average covered call ETF. To do this we used the DUVOLT measure which is the Log of standard deviation of monthly returns for up weeks divided by the standard deviation of monthly returns for down weeks. An up (down) month is defined as a month when the asset-specific month return is above (below) the annual mean. Using this measure we got a poor result of -0.21 which nearly matches the S&P 500 crash risk over the same period.
All in all, the results are clear. Covered call ETFs underperform the S&P 500 and bond indexes on a risk adjusted basis, offer little in diversification benefits and have comparable crash risk as compared to the S&P 500. In sum, it may be something you want to give close scrutiny before deciding to invest.
For more news, information, and strategy, visit ETF Trends.
