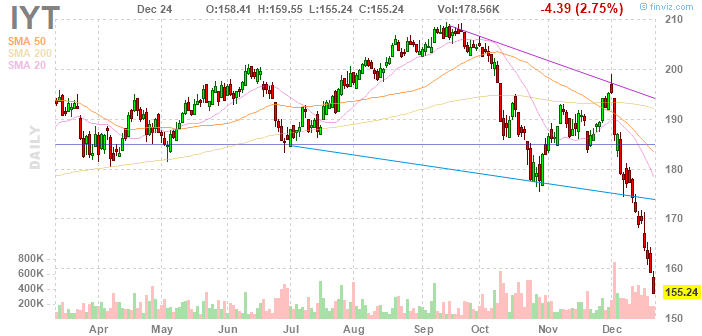
IYT currently resides nearly 26% below its 52-week high and 19.37% below its 200-day moving average. Relative strength readings on the fund indicate it is oversold.
“Looking back over the past eight years or so, there have been only a few previous examples of IYT diving below its 1,000-day moving average while simultaneously trading below both its 200-day and 320-day trendlines, as it is now,” according to Schaeffer’s. “The prior occurrences in 2011 and 2016 coincided with extremely oversold readings from the exchange-traded fund’s (ETF’s) 14-day Relative Strength Index (RSI) — and those breaks below the 1,000-day were relatively brief, lasting anywhere from just two days (around the time of the June 2016 Brexit vote) to just under two months (mid-August to early October 2011, and early January to mid-February 2016).”
For more information on Transportation ETFs, visit our Transportation category.
