
By Todd Rosenbluth, CFRA
Many international equity ETFs are already significantly exposed to Japan. The three largest developed international equity ETFs each have more than 20% of assets in Japanese equities, even as they track different market-cap weighted indexes. The $65 billion iShares Core MSCI EAFE ETF has the highest weighting to Japan (26% of assets) of the three funds, with slightly less exposure to the U.K. (15%), France (9.7%), and Switzerland (9.5%) than investors receive from $46 billion iShares MSCI EAFE ETF (EFA 61 **). Both ETFs track MSCI indexes, but IEFA holds approximately 2,500 stocks, nearly triple the number in EFA, and includes many small-cap companies.
Table 1: Country Exposure of Popular International Equity ETFs
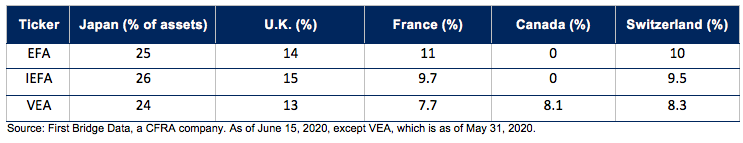
Meanwhile, $70 billion Vanguard FTSE Developed Markets had 24% of assets invested in Japan at the end of May. VEA’s exposure to Switzerland (8.3%) and France (7.7%) is lower than the iShares duo, but the Vanguard fund is the only one of the three to provide Canadian equity stakes (8.1%). VEA owns approximately 4,000 securities, which is also more than its peers.
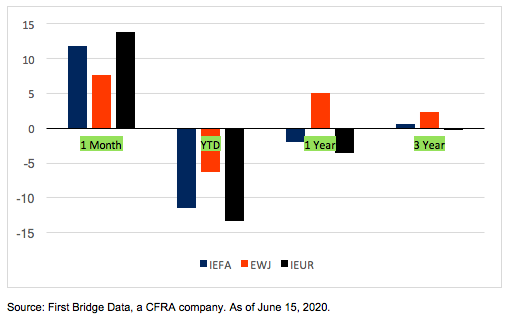
Japan has been a recent bright spot in developed markets. In addition to being the largest country for IEFA, Japan has also provided a boost to the diversified equity ETF. In 2020, iShares MSCI Japan ETF was down just 6.3% year-to-date through June 15, ahead of the 12% loss for IEFA. iShares Core MSCI Europe (IEUR), which closely represents most of the remaining assets for IEFA, was down 13%. EWJ also outperformed IEUR on a one-year basis (up 5.0% vs. down 3.5%) and three-year basis (up 2.3% vs. down 0.2%), though the 7.6% gain in the past month lagged behind IEUR’s 14% climb.
Chart 1: Performance of Developed Equity ETFs
Investors favor the cheaper Japan ETF. Given the strong fundamentals and recent performance, some investors may want to augment existing exposure to Japan using single country ETFs. EWJ has $9.4 billion in assets but charges a relatively high 0.47% expense ratio. While the fund has a 24-year old track record, investors care less about long-term performance with index-based products. Not surprisingly, the lower-priced JPMorgan BetaBuilders Japan ETF has been gaining market share. BBJP has $4.3 billion of assets since its launch in June 2018 — aided by a 0.19% expense ratio and a slightly better recent record that reflects the fund’s cost differential. In the one-year period ended June 15, BBJP rose 5.16%, slightly ahead EWJ’s 5.0% gain.
In the past year, BBJP gathered approximately $570 million of net ETF inflows, compared to $3 billion of outflows for EWJ. The tide turned further in the past month as BBJP pulled in $1.5 billion. But investors are not just trading to the cheaper alternative, as EWJ’s outflows in the past month totaled just nearly $200 million; clearly BBJP is attracting new investors as well.
Table 2: Review of Single Country Japanese ETFs

BBJP’s approximately 370 securities are higher than EWJ’s 328, but these two market-cap weighted funds have similar exposure to sectors and large-cap stocks such as CFRA Buy-recommended Softbank Group and Sony Corp. CFRA has a higher four star recommendation on BBJP; this compares to our forecast for all global equity ETFs based on risk, reward, and cost metrics, rather than just Japanese funds.
Todd Rosenbluth is Director of ETF & Mutual Fund Research at CFRA.
All of the views expressed in this research report accurately reflect the research analyst’s personal views regarding any and all of the subject securities or issuers. No part of the analyst’s compensation was, is, or will be, directly or indirectly, related to the specific recommendations or views expressed in this research report. For more information and disclosures, please refer to CFRA’s Legal Notice at https://www.cfraresearch.com/legal/.
Copyright © 2020 CFRA. All rights reserved. All trademarks mentioned herein belong to their respective owners.
