Let’s take a look at how prices actually moved in 1987 compared to today. The chart below shows the DJIA in 1987 with recent price movement as an overlay. These series start August 9th of 1984 and 2014.
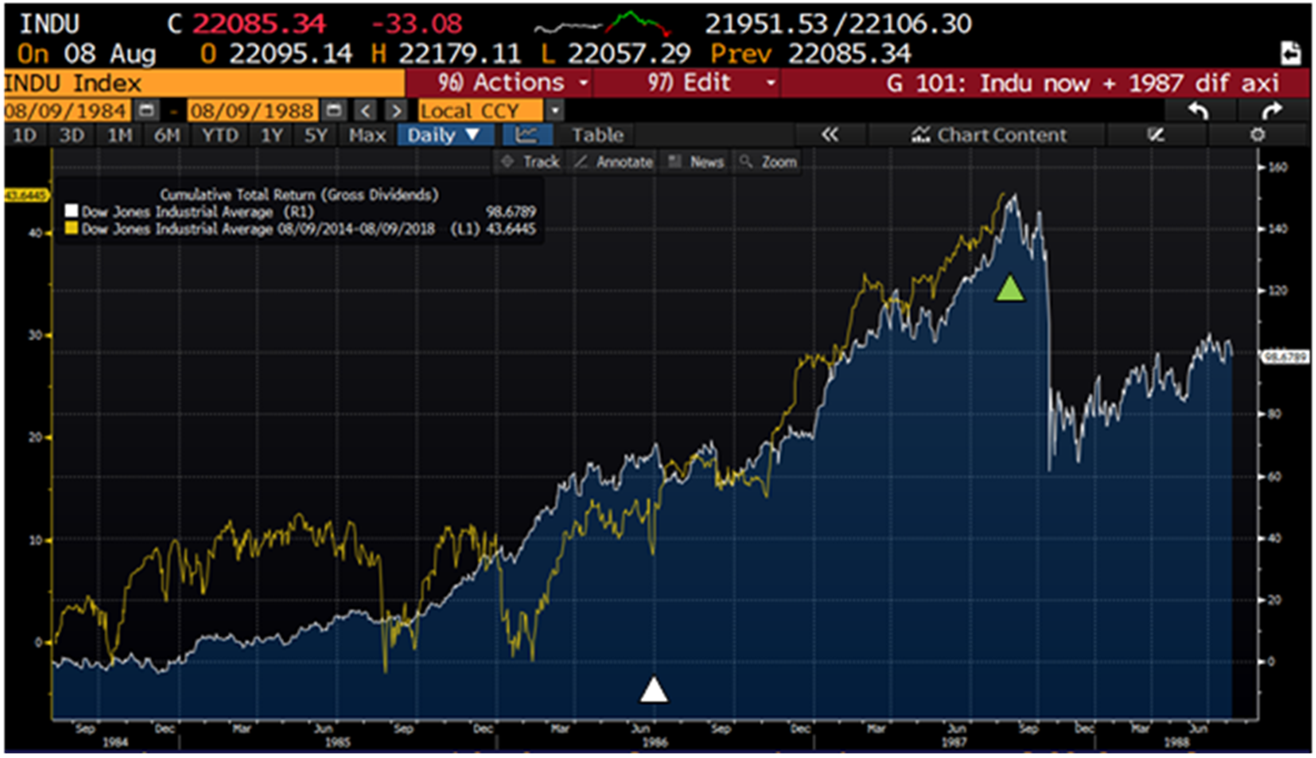
The first thing that catches one’ eye is that the periods of strong upward movements and declines line up fairly well. Based on the apparent synchronization of peaks and troughs, one might conclude that we are on the precipice of a major decline.
However, as mentioned earlier, the level of maturity of the bull market is quite different. We estimate that our current level of maturity is where it was in June of 1986 (white diamond), well over a year before the big decline.
The chart above focused on price patterns, not actual returns. The chart below shows the same price movements in terms of returns.
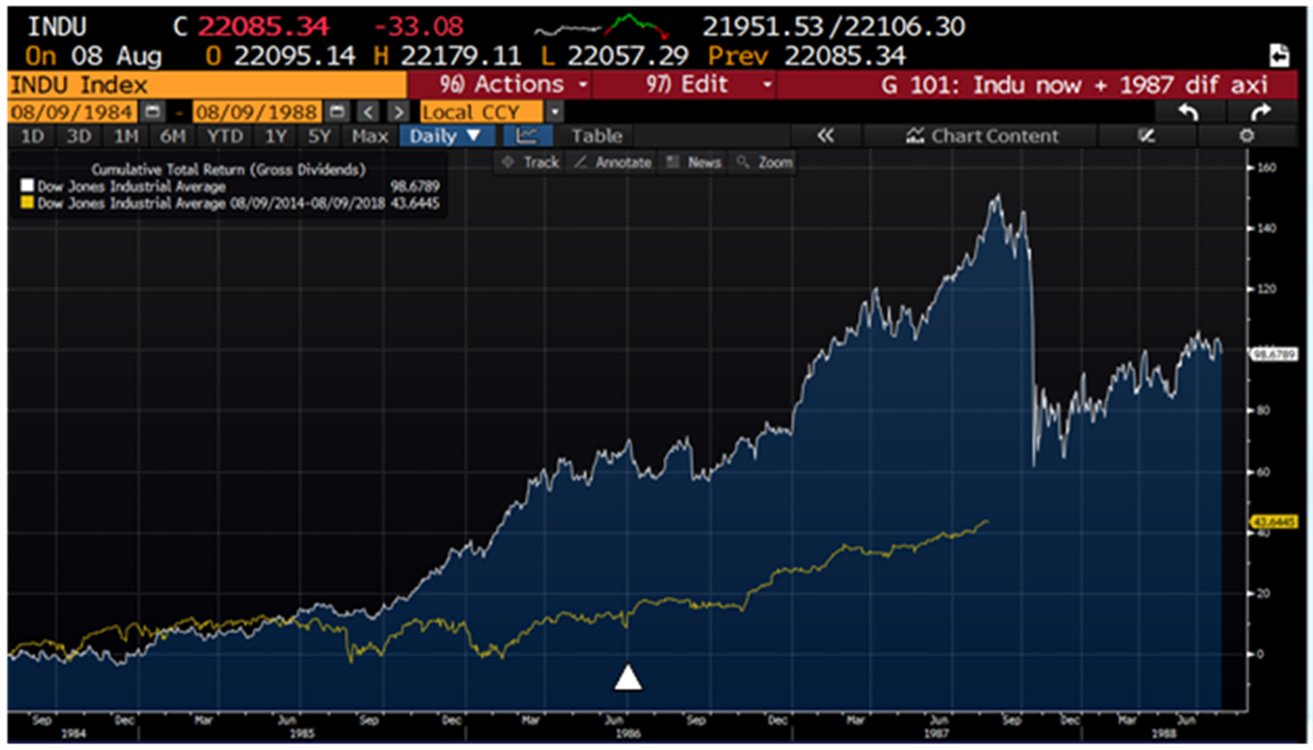
The returns since the beginning of the chart for each time period are quite different. From August 9, 1984 to the top of the market in 1987, the DJIA rose 113%. Over the period from August 9, 2014 to August 9, 2017, it has risen 32%. The difference is big.
This information does not suggest there is no risk at this time. Thirty-two percent in today’s environment may somehow be equivalent to 113% in the 1980s environment of rapidly decreasing interest rates.
Near-term Outlook
I believe we will have a few weeks of soft prices and perhaps moderate declines. When those pass, we can expect a continuation of strong stock prices. The best course of action is to respond to the current dynamics of the market as indicated by the changes in resilience.
Other Markets
Emerging market bonds appear to be at an inflection point. This asset has been resilient for several quarters but is quickly shifting to being vulnerable. There is still short-term resilience, but that is likely to fade in a few weeks. Historically, this asset does not decline dramatically during the early stages of vulnerable periods.
Gold is experiencing short-term resilience, but the longer-term trend is still negative.
The SPGSCI (commodity index) is generally resilient. It has been borderline with a potential shift to vulnerable, but the shift has not taken place. Short-term resilience is developing.
Jeffrey Hansen provides investment research to HNW individuals and investment professionals. With over 30 years of investment experience, he has worked with pension consultants, institutional asset managers, and retail fund companies. CPM Investing focuses on market resilience research.
