
This Q&A answers key questions about MIG and MBBB ETFs and explains how investment-grade corporate bonds offer higher yields than U.S. Treasuries with limited credit risk, making them a strong core choice.
- What are attractively valued bonds?
- What is the fair value of a corporate bond?
- What are the benefits of owning attractively valued bonds?
- Why use the Moody’s Analytics credit risk model?
- What is the methodology of the indices?
- Can you provide some examples of the types of bonds that are selected?
- What drives the outperformance of attractively valued bonds?
- How much outperformance is driven by duration?
- Does the outperformance from owning attractively valued bonds come from taking more risk?
- Risk/Reward (Nov 2020 – Oct 2024)
- Where can I find more information on the methodology and how attractively valued bonds performed historically?
- How can investors buy VanEck’s MIG and MBBB ETFs?
Investment grade corporate bonds provide a yield pickup over risk-free U.S. Treasuries with limited credit risk. They are an attractive core fixed income allocation for many investors because of their relative safety, yield enhancement and diversification potential.
The VanEck Moody’s Analytics IG Corporate Bond ETF (MIG) seeks to track, as closely as possible, before fees and expenses, the price and yield performance of the MVIS® Moody’s Analytics® US Investment Grade Corporate Bond Index while the VanEck Moody’s Analytics BBB Corporate Bond ETF (MBBB) seeks to track, as closely as possible, before fees and expenses, the price and yield performance of the MVIS® Moody’s Analytics® US BBB Corporate Bond Index.
These indices identify the most attractively valued bonds based on their market spread relative to their fair value, a metric calculated by Moody’s Analytics.
What are attractively valued bonds?
We define attractively valued bonds as those offering higher compensation relative to their estimated risk and is measured by comparing their credit spread based on the market price of the bond versus fair value. Bonds with significant excess spread above fair value overcompensate investors relative to actual estimated credit risk.
What is the fair value of a corporate bond?
Fair value estimates the compensation investors should demand for the risk they are taking by holding a bond and is expressed as the “fair value spread.”
Moody’s Analytics calculates the fair value spread based on its expected probability of default, estimated recovery rate, maturity, issue size and other risk factors. It incorporates numerous data points, including a firm’s balance sheet and its equity price to calculate the forward-looking probability of default.
What are the benefits of owning attractively valued bonds?
Attractively valued bonds represent both attractive income potential as well as upside price potential as market spreads converge to fair value. A bond with a positive excess spread versus its fair value spread represents a value opportunity. Similarly, avoiding bonds that exhibit unattractive levels of excess spread provides the potential to outperform the broad market. Holding bonds with low or negative excess spread means that investors are not being adequately rewarded, and these bonds pose downside risk if spread widens as the market begins to price-in higher levels of risk.

Nazaren and Dwyer, Credit Risk Modeling of Public FIlms: EDF9, Moody’s Analytics, June 2015.
Why use the Moody’s Analytics credit risk model?
There is significant dispersion of credit risk pricing within the corporate bond market which offers the ability to build diversified portfolios with alpha potential and Moody’s Analytics is the industry leader in credit risk modelling. Their models have won numerous industry awards, and over 1,000 of the world’s largest institutional investors (including banks, insurance companies, government institutions and asset managers) use their models to power credit risk and portfolio management decision making.
A model is only as good as its inputs and the assumptions that underlie it, and we believe that the quality and coverage of Moody’s Analytics data and the extensive research capabilities and resources dedicated to supporting the model have contributed to Moody’s Analytics industry-leading role.
What is the methodology of the indices?
- The index provider buckets the starting universe of corporate bonds into financials and non-financials, and then by duration.
- It then screens for the liquid and priceable opportunity set of bonds.
- Each bond’s fair value spread is compared to the market spread to determine the most attractively valued bonds.
- The index maintains exposure to the top 40% most attractively valued bonds and removes bonds that exhibit an excessively high probability of being downgraded to high yield.

Can you provide some examples of the types of bonds that are selected?
Case study #1: Weyerhaeuser Company
Weyerhaeuser’s 4.0% 04/15/2030 bond entered the index in October 2022, as it exhibited an attractive excess spread in relation to all other bonds at that time. Its market spread gradually tightened towards fair value through April 2024, at which point it left the index. Although the bond still exhibited positive excess spread, the index focuses on bonds with the highest excess spread in the broad U.S. investment grade corporate market, and more attractive opportunities emerged.

Source: ICE Data Indices, Moody’s Analytics, VanEck as of 10/31/2024. Index performance is not illustrative of fund performance. It is not possible to invest directly in an index. Please see index definitions included in disclosures below.
Case study #2: Kraft Heinz Foods Company
Kraft’s 6.875% 01/26/2039 bond entered the index in March 2023, after being upgraded from high yield to investment grade, as it exhibited higher excess spread relative to its universe.

Source: ICE Data Indices, Moody’s Analytics, VanEck as of 10/31/2024. Index performance is not illustrative of fund performance. It is not possible to invest directly in an index. Please see index definitions included in disclosures below.
What drives the outperformance of attractively valued bonds?
Key factors that have driven outperformance relative to the broader corporate bond market:
- Price Gains – as bond spreads compress, prices tend to rise.
- Risk Management – avoids bonds that don’t offer enough compensation for the risks involved.
Attractively valued bonds have also provided yields that are in line, or higher than, the broad market.
As a result, this approach has delivered stronger total returns compared to standard benchmarks.
| Indices | Price Return (%) | Income Return (%) | Total Return (%) | Out/Underperformance (%) | |
| 1Y | Attractively Valued IG Corporates | 9.50 | 4.92 | 14.42 | 0.79 |
| Broad IG Benchmark | 8.71 | 4.93 | 13.63 | ||
| Attractively Valued BBB Corporates | 10.09 | 5.24 | 15.32 | 0.69 | |
| Broad BBB Benchmark | 9.36 | 5.27 | 14.63 | ||
| 3Y | Attractively Valued IG Corporates | -5.19 | 4.08 | -1.11 | 0.70 |
| Broad IG Benchmark | -5.76 | 3.95 | -1.81 | ||
| Attractively Valued BBB Corporates | -5.30 | 4.33 | -0.97 | 0.49 | |
| Broad BBB Benchmark | -5.74 | 4.28 | -1.46 |
Source: ICE Data Indices as of 10/31/2024. Index performance is not illustrative of fund performance. It is not possible to invest directly in an index. Please see index definitions included in disclosures below.
How much outperformance is driven by duration?
Valuations within the corporate bond universe are best compared against bonds with similar durations and in similar sectors. The indices compare and select bonds within the same sector (financials and non-financials) and within the same duration range to avoid unintended biases (e.g., an overweight to low duration bonds).
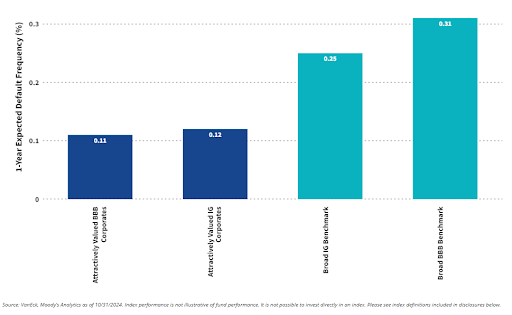
Does the outperformance from owning attractively valued bonds come from taking more risk?
No. Looking at the one-year expected default frequency, a metric estimating the likelihood of the company defaulting over the following 12 months, both indices display lower levels of default risk. Although the risk of default in investment grade bonds is generally very low, even these small differences are reflected in credit spreads and total returns.
Overall, analyzing bonds through the lens of fair value allows investors to buy undervalued bonds and avoid overpriced bonds, which have demonstrated a better risk/reward profile than the broad markets.
Risk/Reward (Nov 2020 – Oct 2024)

Source: Morningstar. Index performance is not illustrative of fund performance. It is not possible to invest directly in an index. Please see index definitions included in disclosures below.
Where can I find more information on the methodology and how attractively valued bonds performed historically?
More detailed information on the methodology can be found here, and this blog describes how attractively valued bonds have performed historically.
How can investors buy VanEck’s MIG and MBBB ETFs?
Learn more here: VanEck Moody’s Analytics IG Corporate Bond ETF and VanEck Moody’s Analytics BBB Corporate Bond ETF.
To receive more Income Investing insights, sign up in our subscription center.
