
By David Schassler, Portfolio Manager for VanEck Global
VanEck NDR Managed Allocation Fund (NDRMX) tactically adjusts its asset class exposures each month across global stocks, U.S. fixed income and cash. It utilizes an objective, data-driven process driven by macroeconomic, fundamental, and technical indicators developed by Ned Davis Research (NDR). The Fund invests based on the weight-of-the-evidence of its objective indicators, removing human emotion and decision making from the investment process. The expanded PDF version of this commentary can be downloaded here.
Overview
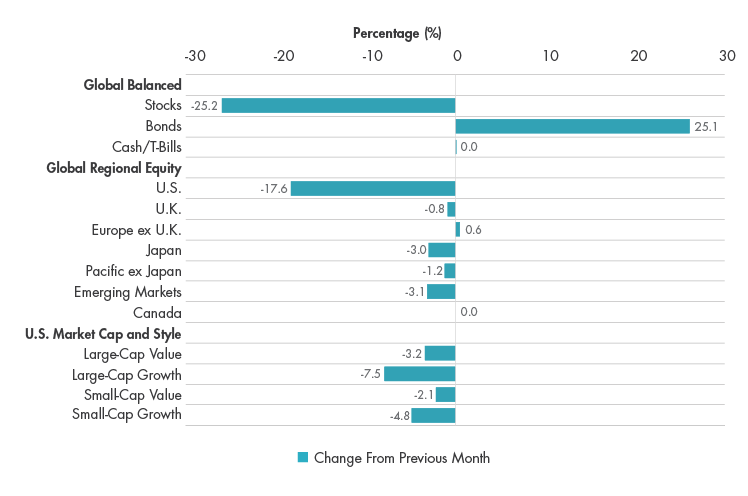
The VanEck NDR Managed Allocation Fund (the “Fund”) returned -4.81% in February versus -4.10% for its blended 60/40 benchmark. The month was challenging for all equity investors as fears of the coronavirus spread globally and threatened both health and economic activity. The S&P 500® Index was down 8.23% and the MSCI All Country World Index was down 8.08%. Bonds benefited from the flight to safety with the Bloomberg Barclays US Aggregate Bond Index up 1.80%. The Fund underperformed mainly due to its equity overweight: it held a 72% allocation to stocks and a 28% allocation to bonds. Regionally, the Fund had a significant overweight to the U.S. equity market. This benefited the Fund as U.S. equities, as measured by the Russell 3000 Index, outperformed global stocks excluding the U.S., as measured by the MSCI All Country World ex. USA Index, by 1.57%. The Fund also had moderate underweight positions in both Europe ex. U.K. and Canada. These detracted from performance, as both Europe ex. UK and Canada outperformed the MSCI All County World Index. Within the U.S., the Fund held a significant overweight in growth versus value. This positioning worked as the Russell 3000 Growth Index outperformed the Russell 3000 Value Index by 2.85%. The heightened risk regime is being well captured the Fund’s model. At the beginning of March, the Fund reduced its equity allocation from 72% to 47% and increased its bond allocation from 28% to 53%. The reduction in equity exposure has led to the Fund being underweight each equity region, with its largest allocation remaining in U.S. equities. Stylistically, the Fund remains overweight growth over value.
Average Annual Total Returns (%) as of February 29, 2020
| Average Annual Total Returns (%) as of February 29, 2020 | |||||
| 1 Mo† | YTD† | 1 Yr | 3 Yr | Since | |
| Inception | |||||
| Class A: NAV (Inception 5/11/16) | -4.81 | -5.36 | 1.20 | 2.63 | 4.26 |
| Class A: Maximum 5.75% load | -10.30 | -10.80 | -4.61 | 0.62 | 2.65 |
| 60% MSCI ACWI/ 40% Bloomberg Barclays US1 Agg. |
-4.10 | -3.99 | 7.63 | 6.76 | 7.42 |
| Morningstar Tactical Allocation Category (average)2 |
-4.91 | -5.11 | 2.76 | 3.36 | 4.34 |
| Average Annual Total Returns (%) as of December 31, 2020 | |||||
| 1 Mo† | YTD† | 1 Yr | 3 Yr | Since | |
| Inception | |||||
| Class A: NAV (Inception 5/11/16) | 2.09 | 11.21 | 11.21 | 5.56 | 6.05 |
| Class A: Maximum 5.75% load | -3.77 | 4.81 | 4.81 | 3.51 | 4.34 |
| 60% MSCI ACWI/ 40% Bloomberg Barclays US1 Agg. |
2.11 | 19.81 | 19.81 | 9.55 | 8.98 |
| Morningstar Tactical Allocation Category (average)2 |
1.98 | 14.61 | 14.61 | 6.46 | 6.07 |
†Returns less than a year are not annualized.
Expenses: Class A: Gross 1.83%; Net 1.36%. Expenses are capped contractually until 05/01/20 at 1.15% for Class A. Caps excluding acquired fund fees and expenses, interest, trading, dividends, and interest payment of securities sold short, taxes, and extraordinary expenses.
The tables present past performance which is no guarantee of future results and which may be lower or higher than current performance. Returns reflect applicable fee waivers and/or expense reimbursements. Had the Fund incurred all expenses and fees, investment returns would have been reduced. Investment returns and Fund share values will fluctuate so that investor’s shares, when redeemed, may be worth more or less than their original cost. Fund returns assume that dividends and capital gains distributions have been reinvested in the Fund at net asset value (NAV). An index’s performance is not illustrative of the Fund’s performance. Indices are not securities in which investments can be made. Index returns assume that dividends of the Index constituents in the Index have been reinvested.
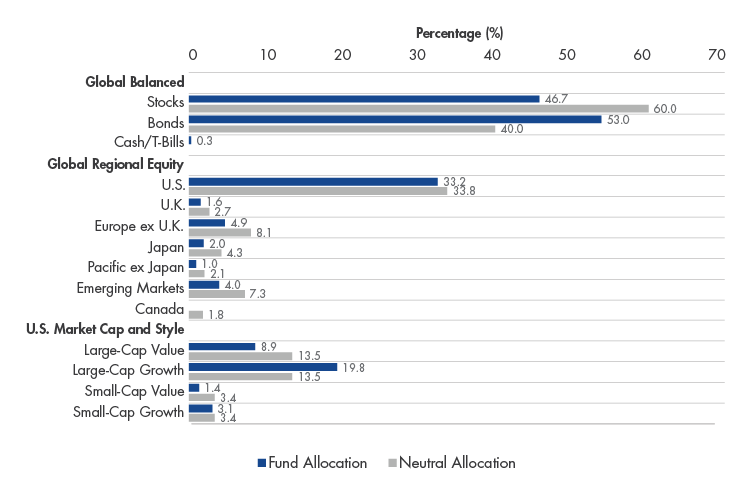
All weighting comparisons are relative to the blended benchmark (60% MSCI /ACWI/40% Bloomberg Barclays US Agg.) or neutral allocation. This represents the starting allocation point absent an alternative recommendation once the model takes into consideration the indicators that yield the global tactical allocation model.
Please see additional information regarding benchmark and Morningstar category performance on last page.
Weight-of-the-Evidence
The Fund is driven by an asset allocation model from Ned Davis Research (“the Model”). This section will outline the risks currently being read by the Model that led to the Fund’s underweight equity allocation in March. Many of the indicators in the Model are reacting to the current market selloff. Below are the indicators that recently turned bearish:
Stocks are underperforming bonds over the medium term, which is often a bad sign for future equity returns.

Copyright 2020, Ned Davis Research, Inc. Further distribution prohibited without prior permission. All Rights Reserved.
See NDR Disclaimer at www.ndr.com/copyright.html. For data vendor disclaimers refer to www.ndr.com/vendorinfo/.
Country market breadth is bearish, which indicates that the decline is broad.

Copyright 2020, Ned Davis Research, Inc. Further distribution prohibited without prior permission. All Rights Reserved.
See NDR Disclaimer at www.ndr.com/copyright.html. For data vendor disclaimers refer to www.ndr.com/vendorinfo/.
The NDR SHUT Indicator (cyclical vs. defensive sectors) turned bearish. This measures the defensive sectors outperforming the cyclical sectors, which is typical in big equity downdrafts.

Copyright 2020, Ned Davis Research, Inc. Further distribution prohibited without prior permission. All Rights Reserved.
See NDR Disclaimer at www.ndr.com/copyright.html. For data vendor disclaimers refer to www.ndr.com/vendorinfo/.
Other indicators that work independently of market prices have been bearish for an extended period of time. The Global PMI Breadth Indicator has been bearish since April 2018 and the Long-Term Earnings Growth Indicator has been bearish since July 2018. The lack of economic growth and earnings growth, combined with excessive valuations, were risk factors that made the markets vulnerable to a sizable correction.
Global economic activity is declining. The diagram below demonstrates that global Purchasing Managers’ Index (PMI) data is in decline. This is a key leading indicator of overall economic performance.

Global earnings growth continues to trend downward. The chart below demonstrates that decline by comparing the 5-month average in earnings growth to the 10-month average in earnings growth.

Copyright 2020, Ned Davis Research, Inc. Further distribution prohibited without prior permission. All Rights Reserved.
See NDR Disclaimer at www.ndr.com/copyright.html. For data vendor disclaimers refer to www.ndr.com/vendorinfo/.
To conclude, the Fund has transitioned from overweight equities to underweight equities. Given the risks, the allocation shift will likely be intuitive to most readers. Eventually the selloff will reach a point at which it creates a buying opportunity. However, as of now, the Model suggests that now is not that time. The Model will continue to measure risks using its objective, data-driven indicators and adjust its exposures as necessary.
NDR Indicator Summary, March 2020
| Macro/Fundamental | Technical | Overall | |
| Stocks, Bond, or Cash | |||
| Stocks (vs. Bonds) | Bearish | Bearish | Bearish |
| Bonds (vs. Cash) | Bullish | Bullish | Bullish |
| Global Regional Equity | |||
| U.S. | Bullish | Bullish | Bullish |
| Canada | Bearish | Bearish | Bearish |
| U.K. | Bullish | Bearish | Neutral |
| Europe ex U.K. | Bearish | Bullish | Neutral |
| Japan | Neutral | Bearish | Bearish |
| Pacific ex Japan | Neutral | Neutral | Neutral |
| Emerging Markets | Neutral | Bearish | Bearish |
| U.S. Cap & Style | |||
| Large-Cap | Neutral | Bullish | Bullish |
| Small-Cap | Neutral | Bearish | Bearish |
| Growth | Bullish | Bullish | Bullish |
| Value | Bearish | Bearish | Bearish |
Allocation Since Inception

Asset Class Positioning vs. Neutral Allocation, March 2020
Asset Class Positioning Changes, March 2020 vs. February 2020
1The Fund’s benchmark is a blended unmanaged index created by the Van Eck Associates Corporation (the “Adviser”) consisting of 60% MSCI All Country World Index (ACWI) and 40% Bloomberg Barclays US Aggregate Bond Index. The MSCI ACWI captures large- and mid-cap representation across 23 developed markets (DM) and 24 emerging markets (EM) countries and covers approximately 85% of the global investable equity opportunity set. The Bloomberg Barclays US Aggregate Bond Index is a broad-based benchmark that measures the investment grade, U.S. dollar- denominated, fixed-rate taxable bond market. This includes treasuries, government -related and corporate securities, mortgage-backed securities, asset-backed securities and collateralized mortgage-backed securities.
2Morningstar category averages are equal-weighted category (total) returns. The calculation is the average of the total returns for all funds in a given category. The standard category average calculation is based on constituents of the category at the end of the period. Total return reflects performance without adjusting for sales charges or the effects of taxation, but is adjusted to reflect all actual ongoing fund expenses and assumes reinvestment of dividends and capital gains. If adjusted, sales charges would reduce the performance quoted.
The Morningstar Tactical Allocation category includes portfolios that seek to provide capital appreciation and income by actively shifting allocations across investments. These portfolios have material shifts across equity regions, and bond sectors on a frequent basis. To qualify for the tactical allocation category, a fund must have minimum exposures of 10% in bonds and 20% in equity. Next, a fund must historically demonstrate material shifts in sector or regional allocations either through a gradual shift over three years or through a series of material shifts on a quarterly basis. Within a three-year period, typically the average quarterly changes between equity regions and bond sectors exceeds 15% or the difference between the maximum and minimum exposure to a single equity region or bond sector exceeds 50%.
As of February 29, 2020, the Fund ranked 138 out of 257 funds for the 1 month period; 133 out of 257 funds for the YTD period; 164 out of 254 funds for the 1 Year period; 156 out of 236 funds for the 3 Year period; and 142 out of 232 funds since inception. As of December 31, 2019, the Fund ranked 135 out of 263 funds for the 1 month period; 202 out of 260 funds for the YTD period; 202 out of 260 funds for the 1 Year period; 157 out of 242 funds for the 3 Year period; and 135 out of 238 funds since inception.
As of February 29, 2020, the Fund ranked 138 out of 257 funds for the 1 month period; 133 out of 257 funds for the YTD period; 164 out of 254 funds for the 1 Year period; 156 out of 236 funds for the 3 Year period; and 142 out of 232 funds since inception. As of December 31, 2019, the Fund ranked 135 out of 263 funds for the 1 month period; 202 out of 260 funds for the YTD period; 202 out of 260 funds for the 1 Year period; 157 out of 242 funds for the 3 Year period; and 135 out of 238 funds since inception.
Global stocks are measured by the MSCI ACWI and U.S. bonds are measured by the Bloomberg Barclays US Aggregate Bond Index. Large-cap stocks are measured by the Russell 1000 Index, an index of the largest 1,000 companies in the Russell 3000 Index. The Russell 1000 Index comprises over 90% of the total market capitalization of all listed U.S. stocks. Small-cap stocks are measured by the Russell 2000 Index, an index which measures the performance of the smallest 2,000 companies within the Russell 3000 Index. Value stocks are measured by the Russell 3000 Value Index, a market-capitalization weighted equity index based on the Russell 3000 Index, which measures how U.S. stocks in the equity value segment perform. Included in the Russell 3000 Value Index are stocks from the Russell 3000 Index with lower price-to-book ratios and lower expected growth rates. Growth stocks are measured by the Russell 3000 Growth Index, a market capitalization weighted index based on the Russell 3000 Index. The Russell 3000 Growth Index includes companies that display signs of above average growth. Companies within the Russell 3000 Index that exhibit higher price-to-book and forecasted earnings are used to form the Russell 3000 Growth Index. U.S. stocks are measured by the Russell 3000 Index which is a capitalization-weighted stock market index that seeks to be a benchmark of the entire U.S stock market. It measures the performance of the 3,000 largest publicly held companies incorporated in America and is based on market capitalization. The MSCI Europe ex UK Index captures large and mid cap representation across 14 developed markets (DM) countries in Europe. The MSCI Canada Index is designed to measure the performance of the large and mid cap segments of the Canada market. The MSCI Pacific ex Japan Index captures large and mid cap representation across 4 of 5 developed markets (DM) countries in the Pacific region (excluding Japan). Emerging Markets stock are measured by the MSCI Emerging Markets Index which captures large and mid cap representation across 24 emerging markets (EM) countries. The MSCI United Kingdom Index is designed to measure the performance of the large and mid cap segments of the UK market.
The S&P 500®Index consists of 500 widely held common stocks, covering four broad sectors (industrials, utilities, financial and transportation). International stocks are measured by the MSCI EAFE wcaptures large and mid cap representation across 21 developed markets countries around the world, excluding the US and Canada. U.S. Dollar Index (DXY) indicates the general international value of the U.S. dollar. The DXY does this by averaging the exchange rates between the U.S. dollar and six major world currencies: Euro, Japanese yen, Pound sterling, Canadian dollar, Swedish kroner, and Swiss franc. Please note that the information herein represents the opinion of the author, but not necessarily those of VanEck, and these opinions may change at any time and from time to time. Non-VanEck proprietary information contained herein has been obtained from sources believed to be reliable, but not guaranteed. Not intended to be a forecast of future events, a guarantee of future results or investment advice. Historical performance is not indicative of future results. Current data may differ from data quoted. Any graphs shown herein are for illustrative purposes only. No part of this material may be reproduced in any form, or referred to in any other publication, without express written permission of VanEck.
All indices are unmanaged and include the reinvestment of all dividends, but do not reflect the payment of transaction costs, advisory fees or expenses that are associated with an investment in the Fund. Certain indices may take into account withholding taxes. An index’s performance is not illustrative of the Fund’s performance. Indices are not securities in which investments can be made. Results reflect past performance and do not guarantee future results.
You can lose money by investing in the Fund. Any investment in the Fund should be part of an overall investment program rather than a complete program. Because the Fund is a “fund-of-funds,” an investor will indirectly bear the principal risks of the exchange-traded products in which it invests, including but not limited to, risks associated with cash and cash equivalents, debt securities, exchange traded products, exchange traded products’ underlying investments, below investment grade securities, commodities and commodity-linked derivatives, commodities and commodity-linked derivatives tax, common stock, concentration, derivatives, emerging markets, investment style, small- medium and large-capitalization companies, limited number of holdings, market, model and data, operational, portfolio turnover and regulatory risks. The Fund will bear its share of the fees and expenses of the exchange-traded products. Consequently, an investment in the Fund entails more direct and indirect expenses than a direct investment in an exchange-traded product. Because the Fund invests in exchange-traded products, it is subject to additional risks that do not apply to conventional mutual funds, including the risks that the market price of an exchange traded product’s shares may be higher or lower than the value of its underlying assets, there may be a lack of liquidity in the shares of the exchange-traded product, or trading may be halted by the exchange on which they trade. Principal risks of investing in foreign securities include changes in currency rates, foreign taxation and differences in auditing and other financial standards. Debt securities may be subject to credit risk and interest rate risk. Investments in debt securities typically decrease in value when interest rates rise. Please call 800.826.2333 or visit vaneck.com for performance information current to the most recent month end and for a free prospectus and summary prospectus. An investor should consider the Fund’s investment objective, risks, charges and expenses carefully before investing. The prospectus and summary prospectus contain this as well as other information. Please read them carefully before investing.
©2020 VanEck.
