
By Imaru Casanova
Deputy Portfolio Manager, Gold and Precious Metals
and
Joe Foster
Portfolio Manager and Strategist, Gold and Precious Metals
Monthly gold market and economic insights from Imaru Casanova, Deputy Portfolio Manager and Joe Foster, Portfolio Manager and Strategist, featuring their unique views on mining and gold’s portfolio benefits. An expanded PDF version of this commentary, including fund specific information can be downloaded here.
Risks rise, gold goes higher
Gold set a new high for the year on March 20, trading at $2,009 per ounce. This represented a $200 move from its monthly low of $1,809 on March 8. Gold climbed its way higher as the markets tried to digest the news and assess the ripple effects of the rapid collapse of Silicon Valley Bank (SVB) and Signature Bank over the course of a weekend. The metal found further support as the risks spread to Europe, with major bank Credit Suisse ultimately needing a rescue, which included the surprise wipeout of $17 billion of the bank’s AT1 bonds. Panic and fear subsided as governments, regulators and central banks worldwide intervened and/or reassured investors in an effort to restore market confidence.
Next, attention turned to the Federal Open Market Committee (FOMC) rate decision on March 22. The U.S. Federal Reserve (Fed) increased the federal funds rate by 0.25% to 5.0%. Rate increases are generally viewed as negative for gold. However, treasury rates, which fell sharply following the banking turmoil, actually fell further after the Fed’s last hike, as did the U.S. dollar. This was positive for gold, which managed to hang on to most of its gains, closing at $1,969 on March 3 – a $142 per ounce (7.8%) advance for the month.
The U.S. dollar (DXY Index)1 fell 2.2%, while the 2-year and 10-year treasury rates dropped 0.79% and 0.45% respectively, during March. Gold stocks outperformed the metal. The NYSE Arca Gold Miners Index (GDMNTR)2 was up 18.7%, and the MVIS Global Juniors Gold Miners Index (MVGDXJTR)3 was up 18.2% during the month of March.
Effect of higher rates in full display
“We believe the market is ignoring the negative effect of sustained higher rates on the global financial system.” This was the main message of our gold outlook in our February commentary. There, we provided an example of the recent defaults by two large office owners caused by this higher interest rate environment, and highlighted potential for more problems from the record levels of debt held globally. The collapse of SVB was triggered by the banks’ need to recapitalize as its large portfolio of treasury bonds declined in value due to rising rates. Most would agree that this past month’s events are textbook examples of why one should own gold, so how did gold do? Here are some of our observations:
- One of the most important observations we can make from the events of the last 3 weeks is that trying to time the gold market is futile. Because of its attributes, we believe that gold should be considered a core component and enjoy a permanent allocation in any portfolio. In particular, its low correlation with most other asset classes make it an effective portfolio diversifier. Black swan events cannot be predicted, but investors can be proactive and maintain a gold allocation that offers some protection when these events do happen. In a recent meeting, perhaps one of our clients put it best: “you always own some gold in case everything else is going down; and when everything else is doing great, that’s fine too, because in that scenario you don’t need gold to do great.”
With that said, gold’s performance over the past +20 years is not too shabby:
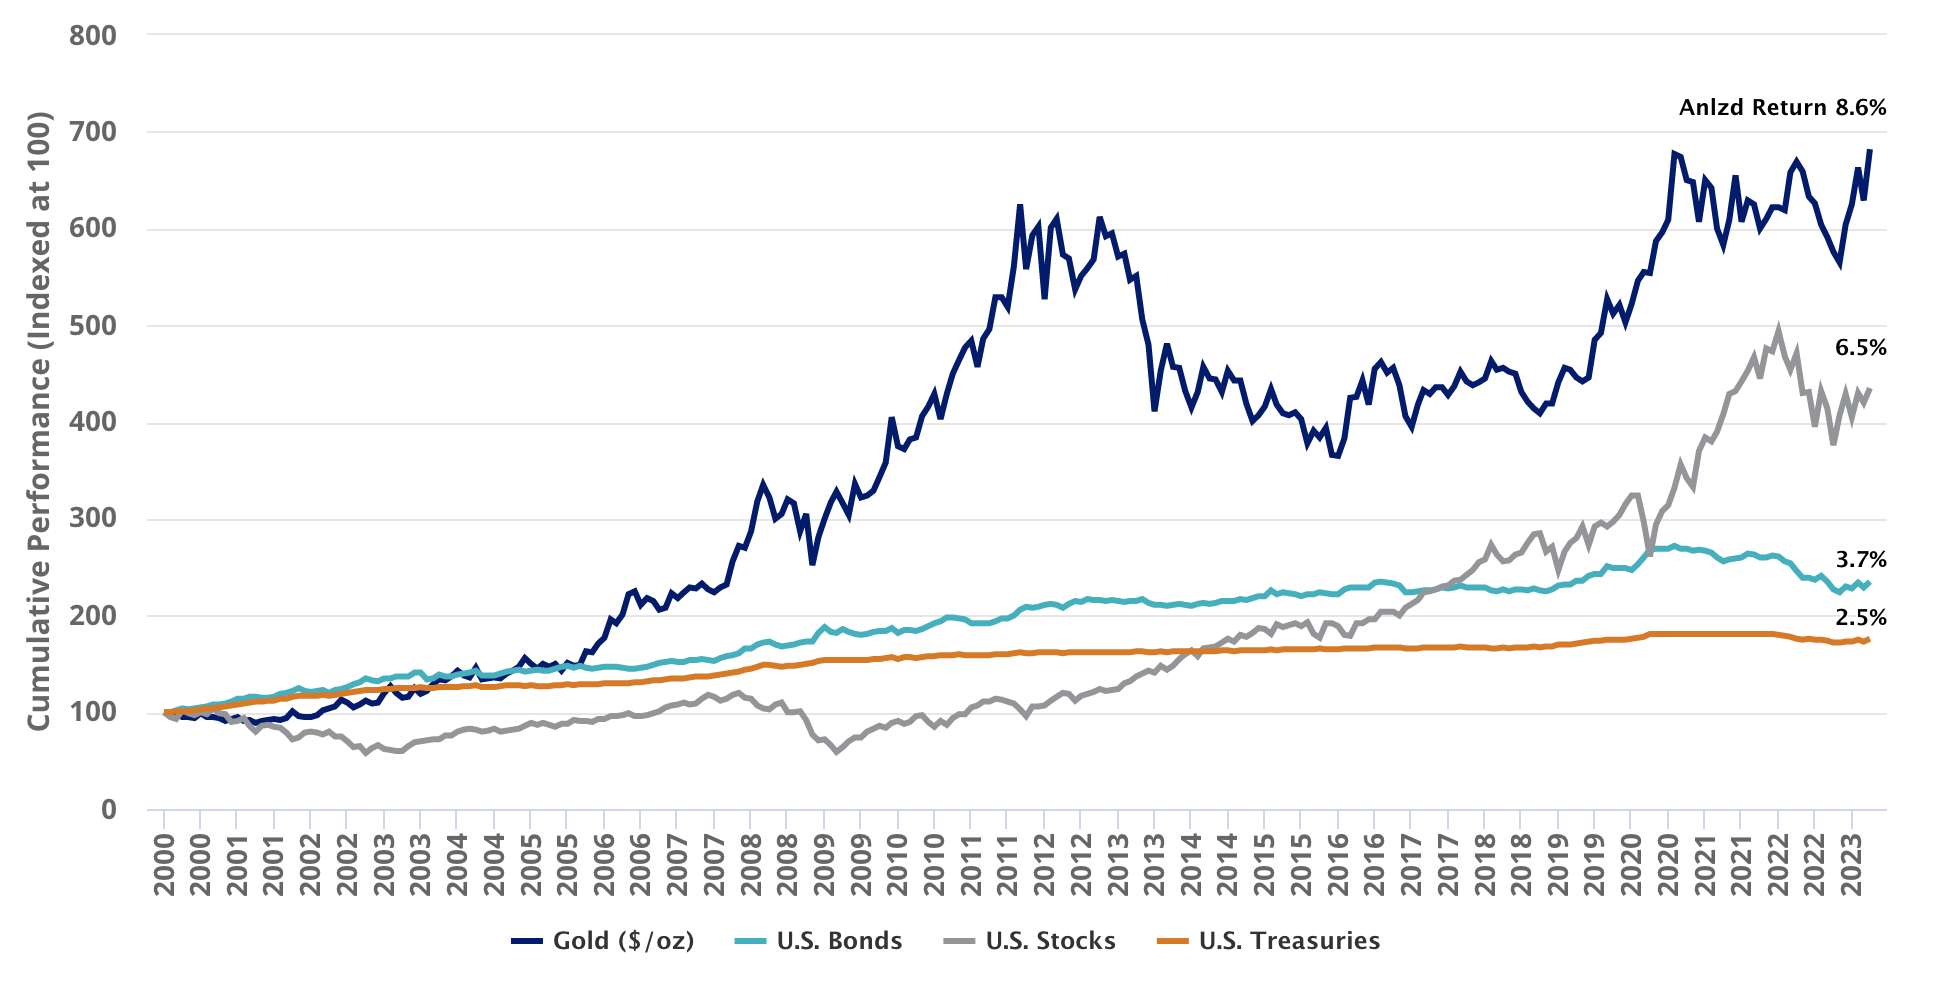
Source: Morningstar. Data as of March 31, 2023. U.S. Stocks represented by S&P® 500 Index; U.S. Bonds represented by Bloomberg Barclays U.S. Aggregate Bond Index; Gold ($/oz) represented by LBMA PM Gold Price; U.S. Treasuries represented by the Bloomberg Barclays U.S. 1-3 Year Treasury Bond Index.
-
- In March, gold did what we would expect it to do in times of crisis. Gold outperformed the U.S. dollar, the S&P 500, the NASDAQ, crude, copper and bonds.

Source: Morningstar. Data as of March 31, 2023. U.S. Stocks represented by S&P® 500 Index; Gold ($/oz) represented by LBMA PM Gold Price; U.S. Treasuries represented by the Bloomberg Barclays U.S. 1-3 Year Treasury Bond Index.
-
- Also, as expected, gold stocks demonstrated their leverage to the gold price by significantly outperforming the metal. It is worth mentioning that gold equities are coming from oversold levels relative to gold over the last two years. Despite the strong performance in March, the equities still have some ways to go to close that gap. For reference, when gold was last $1,970 per ounce in April 2022, GDMNTR was approximately 1,350 vs 1,110 at present.

Source: Bloomberg. Data as of March 31, 2023. Gold Stocks represented by the NYSE Arca Gold Miners Index (GDMNTR).
- Gold sustained its gains even as the Fed hiked one more time. Gold has increased more than 20% over the period of the last three rate hikes – rallying well ahead of a Fed pause or pivot, as it did during the previous rate hiking cycle.
- Global gold bullion ETF holdings, our best proxy for investment demand, finally registered their first month of net inflows since April 2022, with holdings up almost 1% in March. There is a strong positive correlation between the gold price and the holdings of gold ETFs. However, up until March, the recent strength in the gold price had been met with persistent outflows from the gold bullion ETFs. March inflows certainly signal improved gold market sentiment, but current holdings are well below historical levels. The last time gold was $1,970 per ounce, in April of 2022, global gold ETF holdings were more than 12% higher than they are today.
- Gold COMEX net long positioning also picked up. As of March 31, 2023, COMEX net long positions stood at approximately 482 tonnes, according to the World Gold Council. This compares with approximately 819 tonnes in April 2022.
Gold: doing what it’s supposed to, when it supposed to
In short, we would say gold and gold stocks performed precisely how we would expect in this environment. Moreover, we think this performance reaffirms gold’s role as a safe haven investment and as a legitimate form of portfolio insurance. Last month’s developments should act as a wakeup call to those lacking exposure to the gold sector. And the entry point isn’t terrible either. Think about it: despite the heightened level of risk in March, gold didn’t even hit its all-time highs.
We don’t believe the market is fully reflecting the risks ahead. The Fed came to the rescue once again. The crisis seems contained for now. Consumer confidence actually ticked up in March, and the U.S. stock market managed to finish the month with gains. Complacency set in. This market action would suggest the equity market party isn’t over yet. No one wants the party to end, and certainly, no one ever wants to leave too early and miss out. But when there is broken glass on the floor, everyone knows it is time to start figuring out your ride home. Gold may be the perfect vehicle.
Financial stresses still remain
We were assured time and again of the strength and resilience of the banking system after the improved regulatory and supervisory regimes that followed the 2008 financial crisis, and yet here we are facing the biggest U.S. banking failure in more than a decade. The resulting banking crisis exposed the fragility and risks facing the global financial system. We believe this is supportive of higher gold prices in the longer term. These risks include (in both the U.S. and globally) persistent and elevated inflation, a weakening economy, debt service strains, elevated geopolitical risks and black swan events.
Last year, we posed these questions:
- Rapidly rising rates bring significant risks to the financial system. The liability-driven investing (LDI) market crisis in the UK is a clear example of this. Could there be more cracks in the system that start to show under the stress of higher rates, increased volatility and market weakness?
- The world has been operating in a zero-rate environment for a long time, what do higher and rising rates mean to a world consumed in debt?
- How do we service that debt at the same time as we are dealing with slowing growth and high levels of inflation?
These questions are more relevant today than ever. They were reasonable questions to ask in 2022 as the Fed embarked on its aggressive rate hiking cycle. There were and there likely continue to be more cracks in the system – something else could break. A black swan event is generally described as having three main attributes: it is unpredictable; it results in severe and widespread consequences; and after its occurrence people (and markets) will rationalize the event as having been predictable (known as “hindsight bias”). No one saw the failure of SVB coming, it certainly had severe consequences and, of course, now everyone is wondering how management and regulators could have possibly missed it! There may be more black swans flying or swimming around out there.
Market’s underestimating a hard landing?
Worsening financial conditions are expected to lead to the end of the Fed’s rate hiking cycle. The market is already pricing in cuts in 2023. This is gold positive. However, we believe the market has yet to price in the negative impact of a policy change in the fight against inflation and the increasing likelihood of a hard landing or recession. Gold’s appeal increases under these scenarios. As evidenced by the gold ETF and Comex positioning, investors have yet to come back in full force to benefit from gold’s role as an inflation hedge, as a safe haven in periods of economic, financial and geopolitical volatility, and importantly, as a portfolio diversifier. What happened in March should crystallize the need to add gold exposure to every portfolio.
To receive more insights to Gold Investing insights, sign up in our subscription center.
Originally published by VanEck on April 13, 2023.
For more news, information, and analysis, visit the Beyond Basic Beta Channel.
Important Disclosures
All company, sector, and sub-industry weightings as of March 31, 2023 unless otherwise noted.
Please note that VanEck may offer investments products that invest in the asset class(es) or industries included in this communication.
This is not an offer to buy or sell, or a solicitation of any offer to buy or sell any of the securities mentioned herein. The information presented does not involve the rendering of personalized investment, financial, legal, or tax advice. Certain statements contained herein may constitute projections, forecasts and other forward looking statements, which do not reflect actual results.
Nothing in this content should be considered a solicitation to buy or an offer to sell shares of any investment in any jurisdiction where the offer or solicitation would be unlawful under the securities laws of such jurisdiction, nor is it intended as investment, tax, financial, or legal advice. Investors should seek such professional advice for their particular situation and jurisdiction.
1The U.S. Dollar Index measures the value of the U.S. dollar relative to a basket of foreign currencies, often referred to as a basket of U.S. trade partners’ currencies. 2NYSE Arca Gold Miners Index (GDMNTR) is a modified market capitalization-weighted index comprised of publicly traded companies involved primarily in the mining for gold. 3MVIS Global Junior Gold Miners Index (MVGDXJTR) is a rules-based, modified market capitalization-weighted, float-adjusted index comprised of a global universe of publicly traded small- and medium-capitalization companies that generate at least 50% of their revenues from gold and/or silver mining, hold real property that has the potential to produce at least 50% of the company’s revenue from gold or silver mining when developed, or primarily invest in gold or silver.
S&P® 500 Index tracks the stock performance of 500 of the largest companies listed on stock exchanges in the United States.
Bloomberg Barclays U.S. Aggregate Bond Index is a broad-based fixed-income index used by bond traders and the managers of mutual funds and exchange-traded funds (ETFs) as a benchmark to measure their relative performance.
Bloomberg Barclays U.S. 1-3 Year Treasury Bond Index measures the performance of the US government bond market and includes public obligations of the U.S. Treasury with a maturity between 1 and up to (but not including) 3 years.
Any indices listed are unmanaged indices and include the reinvestment of all dividends, but do not reflect the payment of transaction costs, advisory fees or expenses that are associated with an investment in a Fund. Certain indices may take into account withholding taxes. An index’s performance is not illustrative of a Fund’s performance. Indices are not securities in which investments can be made.
Investments in commodities can be very volatile and direct investment in these markets can be very risky, especially for inexperienced investors.
NYSE Arca Gold Miners Index is a service mark of ICE Data Indices, LLC or its affiliates (“ICE Data”) and has been licensed for use by VanEck ETF Trust (the “Trust”) in connection with VanEck Gold Miners ETF (the “Fund”). Neither the Trust nor the Fund is sponsored, endorsed, sold or promoted by ICE Data. ICE Data makes no representations or warranties regarding the Trust or the Fund or the ability of the NYSE Arca Gold Miners Index to track general stock market performance.
ICE DATA MAKES NO EXPRESS OR IMPLIED WARRANTIES, AND HEREBY EXPRESSLY DISCLAIMS ALL WARRANTIES OF MERCHANTABILITY OR FITNESS FOR A PARTICULAR PURPOSE WITH RESPECT TO THE NYSE ARCA GOLD MINERS INDEX OR ANY DATA INCLUDED THEREIN. IN NO EVENT SHALL ICE DATA HAVE ANY LIABILITY FOR ANY SPECIAL, PUNITIVE, INDIRECT, OR CONSEQUENTIAL DAMAGES (INCLUDING LOST PROFITS), EVEN IF NOTIFIED OF THE POSSIBILITY OF SUCH DAMAGES.
MVIS Global Junior Gold Miners Index (the “Index”) is the exclusive property of MarketVector Indexes GmbH (a wholly owned subsidiary of Van Eck Associates Corporation), which has contracted with Solactive AG to maintain and calculate the Index. Solactive AG uses its best efforts to ensure that the Index is calculated correctly. Irrespective of its obligations towards MarketVector Indexes GmbH, Solactive AG has no obligation to point out errors in the Index to third parties. The VanEck Junior Gold Miners ETF (the “Fund”) is not sponsored, endorsed, sold or promoted by MarketVector Indexes GmbH and MarketVector Indexes GmbH makes no representation regarding the advisability of investing in the Fund.
Please note that the information herein represents the opinion of the author, but not necessarily those of VanEck, and this opinion may change at any time and from time to time. Non-VanEck proprietary information contained herein has been obtained from sources believed to be reliable, but not guaranteed. Not intended to be a forecast of future events, a guarantee of future results or investment advice. Historical performance is not indicative of future results. Current data may differ from data quoted. Any graphs shown herein are for illustrative purposes only. No part of this material may be reproduced in any form, or referred to in any other publication, without express written permission of VanEck.
Diversification does not assure a profit or protect against loss.
All investing is subject to risk, including the possible loss of the money you invest. As with any investment strategy, there is no guarantee that investment objectives will be met and investors may lose money. Diversification does not ensure a profit or protect against a loss in a declining market. Past performance is no guarantee of future performance.
©️ Van Eck Securities Corporation, Distributor, a wholly owned subsidiary of Van Eck Associates Corporation.
666 Third Avenue | New York, NY 10017
