
By Jan van Eck, CEO for VanEck Global
China has been a major contributor to global growth, and its economic activity tends to have significant repercussions for the global economy. To understand where the Chinese economy is in its growth cycle, the two charts below are perhaps the only charts one needs.
Chinese Economy Health Check: PMIs
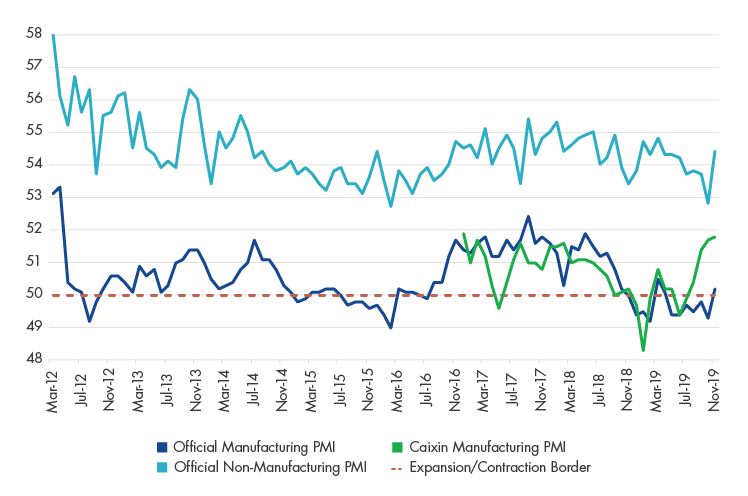
Source: Bloomberg. Data as of November 30, 2019. Data for Caixin Manufacturing PMI was not available prior to December 2016. Past performance is no guarantee of future results. Chart is for illustrative purposes only.
Purchasing managers’ indices (PMIs)1are a better indicator of the health of the Chinese economy than the gross domestic product (GDP) number, which is politicized and is a composite in any case. The manufacturing and non-manufacturing, or service, PMIs have been separated in order to understand the different sectors of the economy. These days, the manufacturing PMI is the number to watch for cyclicality. The main takeaway from November’s activity gauges is that China’s stimulus appears to be working. Both the official and Caixin PMIs were stronger than expected, with the former driven by new domestic orders (mostly infrastructure). The official PMIs’ sharp rise looks almost too good, which raises suspicions of seasonality, so we would not be surprised to see a pullback next month. The Caixin manufacturing PMI, which focuses more on privately owned smaller companies, continued its gradual ascent and saw modest improvement to 51.8. This is the fourth consecutive month of expansion, which provides a more viable signal that the drip stimulus is helping to offset the negative impact of trade uncertainty on domestic activity—without opening the credit floodgates.
Understanding the Credit Cycle: Non-SOE Borrowing Costs

Source: UBS. Data as of October 31, 2019. Past performance is no guarantee of future results. Chart is for illustrative purposes only. Spreads are measured relative to average yield of 1, 3, 5, and 10 year bonds issued by the China Development Bank.
As with any economy, central bank policy is very important in China. In this chart, we can see that interest rates for the private sector fluctuate, whereas the interest rates paid by state-owned enterprises (SOEs) are pretty stable. Therefore, to understand the credit cycle, we point your attention to this private sector, or non-SOE, interest rate. It spiked in 2018, as a result of China’s crackdown on shadow banking2, meaning tougher lending conditions for the private sector. These interest rates began trending down in the winter of 2018 as the “drip stimulus” appeared to take effect. After a recent stint of rising funding costs for private firms, this trend has been reversed, which signals that the preferential policy moves towards the private sector are bringing results.
A combination of monetary policy restraint with tight real estate and environmental regulations, the ongoing deleveraging in shadow financing, and a push for lower financing costs for smaller/private companies (from the official banking sector) suggest that authorities chose a tougher and less “glamorous” policy approach. In our view, they appear to be addressing the quality of growth rather than just growth rates. If this is the case, we believe results will take longer to show up, but may be more sustainable.
DEFINITIONS AND DISCLOSURES
[1] Purchasing managers index (PMI) is an economic indicator derived from monthly surveys of private sector companies. A reading above 50 indicates expansion, and a reading below 50 indicates contraction.
[2] Shadow banking comprises private credit intermediation occurring outside the formal banking system.
Please note that Van Eck Securities Corporation (an affiliated broker-dealer of Van Eck Associates Corporation) offer investment products that invest in the asset classes discussed in this commentary.
This is not an offer to buy or sell, or a solicitation of any offer to buy or sell any of the securities mentioned herein. The information presented does not involve the rendering of personalized investment, financial, legal, or tax advice. Certain statements contained herein may constitute projections, forecasts and other forward looking statements, which do not reflect actual results, are valid as of the date of this communication and subject to change without notice. Information provided by third party sources are believed to be reliable and have not been independently verified for accuracy or completeness and cannot be guaranteed. The information herein represents the opinion of the author(s), but not necessarily those of VanEck.
All investing is subject to risk, including the possible loss of the money you invest. As with any investment strategy, there is no guarantee that investment objectives will be met and investors may lose money. Diversification does not ensure a profit or protect against a loss in a declining market. Past performance is no guarantee of future results.
