
By Jan van Eck, CEO, VanEck Global
China has been a major contributor to global growth, and its economic activity tends to have significant repercussions for the global economy. To understand where the Chinese economy is in its growth cycle, we highlight a few key charts below, which may also provide context for the impact of the coronavirus.
Chinese Economy Health Check: PMIs
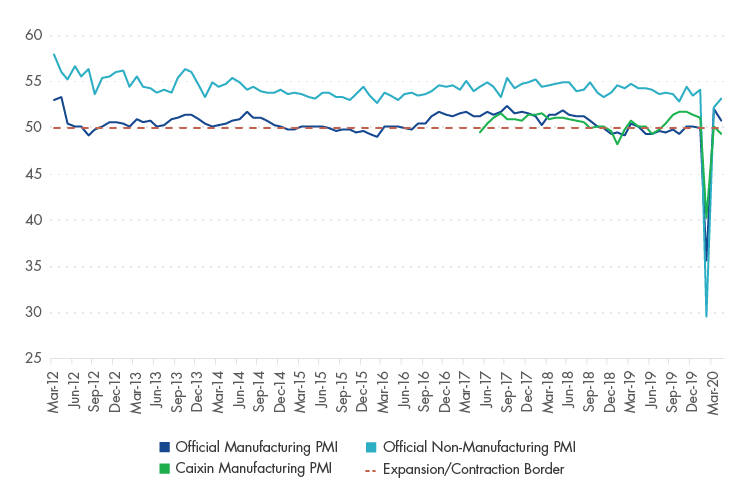
Bloomberg. Data as of April 30, 2020. Past performance is no guarantee of future results. Chart is for illustrative purposes only.
We believe purchasing managers’ indices (PMIs)1are a better indicator of the health of the Chinese economy than the gross domestic product (GDP) number, which is politicized and is a composite in any case. The manufacturing and non-manufacturing, or service, PMIs have been separated in order to understand the different sectors of the economy, and the Caixin manufacturing PMI has a larger share of private companies. These days, the manufacturing PMI is the number to watch for cyclicality.
China’s April official activity gauges confirm that external headwinds pose a major near-term risk for domestic recovery. Following the sharp rebound in March, the new export orders PMI dropped back to the 30s, contributing to the overall weakness of the official manufacturing PMI, 50.8. The Caixin manufacturing PMI fared even worse, slipping to 49.4, back into contraction territory. However, a bright spot in the latest numbers is the ongoing recovery of the services PMI, which rose to 53.2. The small companies PMI also saw a small improvement.
An open question on China’s economic recovery is whether the wall of liquidity unleashed by authorities is making a big difference in the real economy. The jury is still out. The growth of M12 money aggregate—which is often considered a leading indicator of corporate activity—continued to rebound after hitting rock bottom in January, but remains low at 5% year-on-year.
Understanding the Credit Cycle: Non-SOE Borrowing Costs

Source: UBS. Data as of April 30, 2020. Past performance is no guarantee of future results. Chart is for illustrative purposes only. Spreads are measured relative to average yield of 1, 3, 5, and 10 year bonds issued by the China Development Bank.
As with any economy, central bank policy is very important in China. In this chart, we can see that interest rates for the private sector fluctuate, whereas the interest rates paid by state-owned enterprises (SOEs) are pretty stable. Therefore, to understand the credit cycle, we point your attention to this private sector, or non-SOE, interest rate. It spiked in 2018, as a result of China’s crackdown on shadow banking3, meaning tougher lending conditions for the private sector. These interest rates began trending down in the winter of 2018 as the “drip stimulus” appeared to take effect.
China’s non-SOE spreads narrowed sharply between mid-February and mid-March 2020 as widespread lockdowns resulted in a lack of demand. As activity started to recover, so did the funding costs. The good news is that the spread widening appears to be over. Further, the average non-SOE bond yield continues to decline and is now below 5% for the first time since late 2016. The stimulus appears to be trickling through, but sometimes taking “two steps forward, one step back” as China’s transmission mechanism is not perfect. We believe this is an argument in favor of additional policy support—especially for smaller and privately-owned companies—as the global backdrop is unlikely to improve materially until Q3.
China Corporate Yields and CDB Bond Yield (%)

Source: UBS. Data as of April 30, 2020. Past performance is no guarantee of future results.
DEFINITIONS AND DISCLOSURES
1Purchasing managers index (PMI) is an economic indicator derived from monthly surveys of private sector companies. A reading above 50 indicates expansion, and a reading below 50 indicates contraction.
2M1 is a measure of money supply in China that includes cash and demand deposits.
3Shadow banking comprises private credit intermediation occurring outside the formal banking system.
Please note that Van Eck Securities Corporation (an affiliated broker-dealer of Van Eck Associates Corporation) offer investment products that invest in the asset classes discussed in this commentary.
This is not an offer to buy or sell, or a solicitation of any offer to buy or sell any of the securities mentioned herein. The information presented does not involve the rendering of personalized investment, financial, legal, or tax advice. Certain statements contained herein may constitute projections, forecasts and other forward looking statements, which do not reflect actual results, are valid as of the date of this communication and subject to change without notice. Information provided by third party sources are believed to be reliable and have not been independently verified for accuracy or completeness and cannot be guaranteed. The information herein represents the opinion of the author(s), but not necessarily those of VanEck.
All investing is subject to risk, including the possible loss of the money you invest. As with any investment strategy, there is no guarantee that investment objectives will be met and investors may lose money. Diversification does not ensure a profit or protect against a loss in a declining market. Past performance is no guarantee of future results.
