
By Jan van Eck, CEO for VanEck
China has been a major contributor to global growth, and its economic activity tends to have significant repercussions for the global economy. To understand where the Chinese economy is in its growth cycle, the two charts below are perhaps the only charts one needs.
Chinese Economy Health Check: PMIs

Purchasing managers’ indices (PMIs)1 are a better indicator of the health of the Chinese economy than the gross domestic product (GDP) number, which is politicized and is a composite in any case. The manufacturing and non-manufacturing, or service, PMIs have been separated in order to understand the different sectors of the economy. These days, the manufacturing PMI is the number to watch for cyclicality.
Chinese officials have to be happy that their mix of “drip stimulus” is working. China’s latest official activity survey was a snoozer, which is good news against the backdrop of escalating trade tensions. The manufacturing PMI is still on the slightly weak side but rebounded a bit more than expected in September (to 49.8). The services PMI continues to rock, well in the expansion zone at 53.7.
Understanding the Credit Cycle: Non-SOE Borrowing Costs
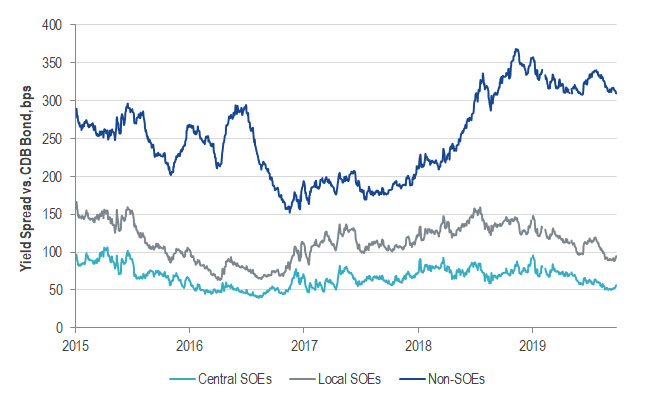
As with any economy, central bank policy is very important in China. In this chart, we can see that interest rates for the private sector fluctuate, whereas the interest rates paid by state-owned enterprises (SOEs) are pretty stable. Therefore, to understand the credit cycle, we point your attention to this private sector, or non-SOE, interest rate.
It spiked in 2018, as a result of China’s crackdown on shadow banking2, meaning tougher lending conditions for the private sector. These interest rates began trending down in the winter of 2018 as the “drip stimulus” appeared to take effect. After a recent stint of rising funding costs for private firms, this trend has been reversed, which signals that the preferential policy moves towards the private sector are bringing results. However, interest rates for private companies are still painfully high when compared to state-owned enterprises. This continues to pose a longer-term structural headwind to growth.
For more insights on China, please see VanEck’s outlook for China in 2019.
DEFINITIONS AND DISCLOSURES
1Purchasing managers index (PMI) is an economic indicator derived from monthly surveys of private sector companies. A reading above 50 indicates expansion, and a reading below 50 indicates contraction.
2Shadow banking comprises private credit intermediation occurring outside the formal banking system.
Please note that Van Eck Securities Corporation (an affiliated broker-dealer of Van Eck Associates Corporation) offer investment products that invest in the asset classes discussed in this commentary.
This is not an offer to buy or sell, or a solicitation of any offer to buy or sell any of the securities mentioned herein. The information presented does not involve the rendering of personalized investment, financial, legal, or tax advice. Certain statements contained herein may constitute projections, forecasts and other forward looking statements, which do not reflect actual results, are valid as of the date of this communication and subject to change without notice. Information provided by third party sources are believed to be reliable and have not been independently verified for accuracy or completeness and cannot be guaranteed. The information herein represents the opinion of the author(s), but not necessarily those of VanEck.
All investing is subject to risk, including the possible loss of the money you invest. As with any investment strategy, there is no guarantee that investment objectives will be met and investors may lose money. Diversification does not ensure a profit or protect against a loss in a declining market. Past performance is no guarantee of future results.
