For any multifactor investor, it’s critical to really put the microscope on the excess returns of a fund to try and identify the main return drivers. And a good starting point is probably to regress a fund’s excess returns on a number of single factors to determine two things: the right factors that explain the excess returns, and, what those sensitivities look like. An example will help.
Using single and multifactor index returns from FTSE Russell, we regressed the daily excess returns of the FTSE Russell Comprehensive Factor Index on the excess returns to the five single factors that the index incorporates – value, size, momentum, low volatility and quality. The results are shown in Figure One.
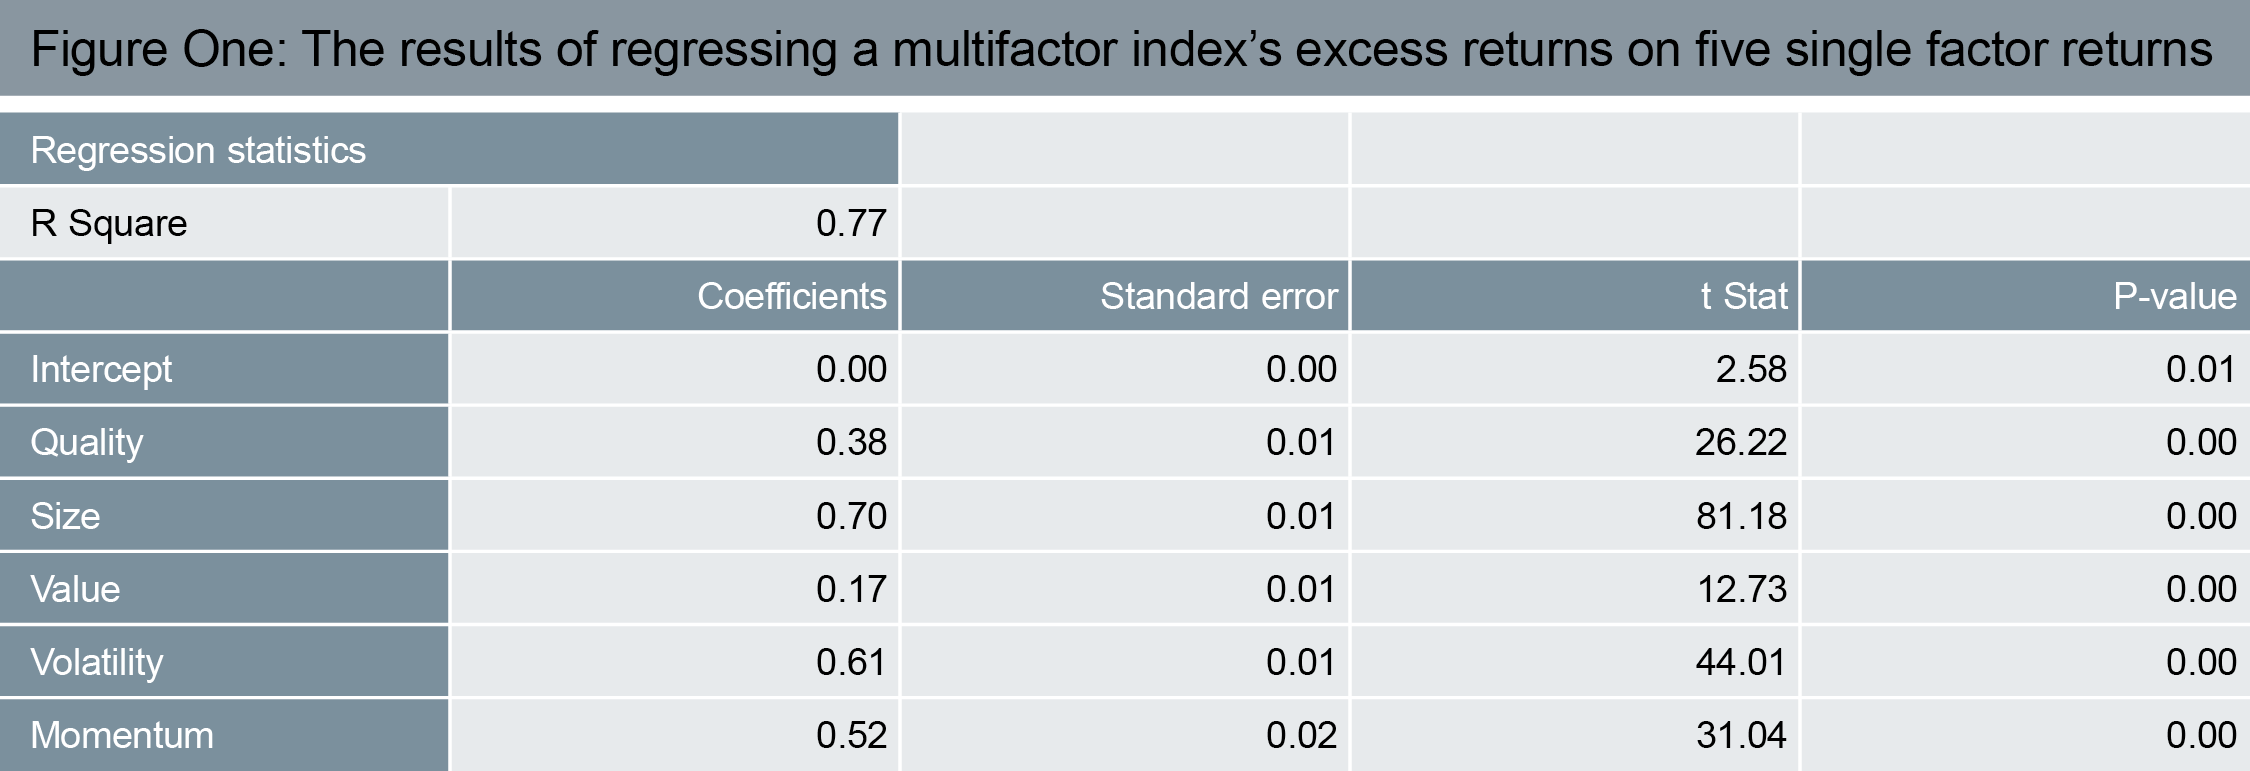
Source: Deutsche Asset Management 6/30/2001—6/30/2016. The T-statistic is used to test hypotheses. It is a ratio of the departure of an estimated parameter from its notional value (total value of a leveraged position’s assets) and its standard deviation (volatility). The p-value is the level of marginal significance within a statistical hypothesis test representing the probability of the occurrence of a given event. Past performance does not guarantee future results.
There are a few important points to consider with a process like this: understanding the numbers, interpreting them, and caveating them.
Understanding
First, the r-square. This number provides the proportion of variability in excess return explained by the five factors. Here, that number is 77% which is quite high. It means that the majority of the variability is indeed accounted for by the reasons that you’d hope (overweighting stocks that have these characteristics).
The coefficients to each of the factors are really just “betas”, and can be interpreted in the same way that we’d interpret the beta of any single stock – a gauge of sensitivity to another variable. So, just as we’d be used to saying that Stock A’s beta of 1.2 means that, on average, if the market is up by 10%, then Stock A should be up by 12%, we can say that the 0.38 beta for Quality means that if the excess return to the Quality factor is 1% then that ought to contribute 0.38% to the excess return on average.
Finally, standard error, t-statistics and p-values give an idea of the statistical significance of the betas and should not be ignored. Significant betas should have low standard errors, high t-statistics and low p-values. A rule of thumb is that a t-statistic above two means that the beta is significant (i.e. different from zero). Note again that for all five of these factors that is the case.
Interpretation
One way to usefully interpret these numbers is to consider the fact that, if you multiply the betas (coefficients) by their respective excess returns, then that should describe the total excess return. So, for example, on a day when each of the five excess returns was 1%, then one would expect the excess return to the multifactor index to be 2.38% (1% * 0.38 + 1% * 0.70 + 1% * 0.17 + 1% * 0.61 + 1% * 0.52). This is the so-called fitted-value and it can be helpful to plot the fitted value against the actual returns to confirm visually that the relationship broadly holds.
