By Analyst, Strategy Indices, &P Dow Jones Indices
After a long bull market, the COVID-19 pandemic has shaken the financial markets and put the question of how to earn a smooth return stream over a long period of time back on the table. This has given rise to a strengthening of conviction toward environmental, social, and governance (ESG) investing and risk management.
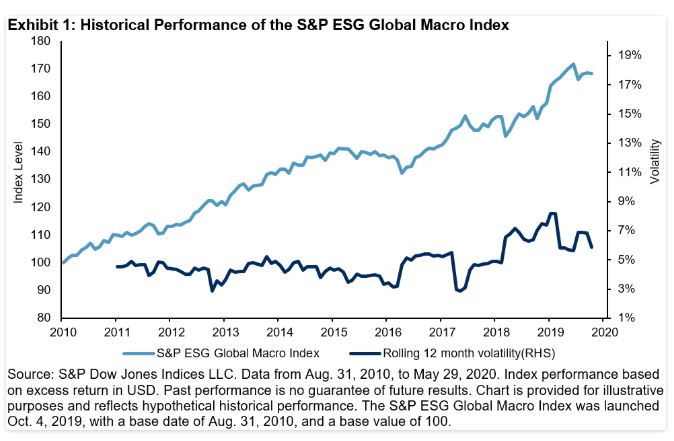
S&P Dow Jones Indices recently launched the S&P ESG Global Macro Index, which is designed to deliver stable returns through various market conditions and to align investments with ESG values.
The index exploits dynamic allocation between regional diversified bonds and ESG-themed equities based on economic and market trend signals and aims for a stable risk level by adjusting allocation between the portfolio and cash on a daily basis.
Over nearly the past 10 years, the index delivered an annualized return of 5.43%, volatility of 4.87%, a Sharpe ratio of 1.12, and a maximum drawdown of 6.35%. During the COVID-19 sell-off, the S&P 500® ER [1] fell 34.09% from Feb. 19, 2020, to March 23, 2020, while the S&P ESG Global Macro Index returned -4.44%.

Two key aspects of the index design are 1) ESG value alignment and 2) diversification through dynamic asset allocation. Both aim to mitigate the negative impact on index return during market turbulence.
ESG Value Alignment
The equity basket of the S&P ESG Global Macro Index consists of the S&P 500 ESG Index, S&P Europe 350 ESG Index, and S&P Japan 500 ESG Index. Theses indices are composed of companies with the top 75% S&P DJI ESG Scores within each industry group, while excluding companies involved with tobacco or controversial weapons, or with low United Nations Global Compact scores. These indices provide meaningful ESG performance improvement with little tracking error against the non-ESG benchmarks.
During the COVID-19 sell-off, [2] the S&P 500 ESG Index and S&P Europe 350 ESG Index outperformed their benchmarks by 0.69% and 0.24%, respectively, while the S&P Japan 500 ESG Index slightly underperformed its benchmark by 0.23%.
Dynamic Allocation
The dynamic allocation mechanism used in the S&P ESG Global Macro Index has historically been effective at reducing risk and improving risk-adjusted return.
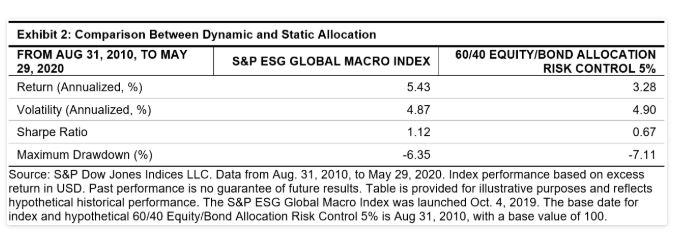
To demonstrate this, we constructed a hypothetical multi-asset portfolio that mimics the exact setting of the S&P ESG Global Macro Index, except that the allocation to equity and bond baskets are at constant 60% and 40%, rather than dynamically determined by macroeconomic and market trend signals. [3]
Over nearly the past 10 years, the S&P ESG Global Macro Index provided a meaningfully higher absolute return and Sharpe ratio than the hypothetical portfolio, with the same level of volatility and slightly lower maximum drawdown (see Exhibit 2).

How did the index typically perform in bear and bull markets? We showcase two historical scenarios.
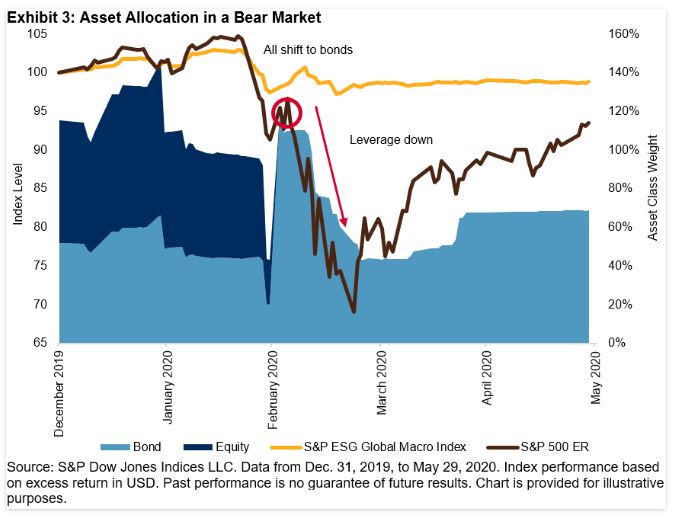
Scenario A: The Bear Market from Feb 19, 2020, to March 23, 2020
During the COVID-19 sell-off, the S&P ESG Global Macro Index shielded investors from large losses through its dynamic asset allocation and risk control overlay.
- From Feb. 19, 2020, to March 10, 2020, the equity market tumbled, while bond prices increased. The index began this period with a 60% allocation to equities, and it switched entirely to bonds at the beginning of March. The negative correlation between equities and bonds helped to defend the portfolio levels from Feb. 19, 2020, to Feb. 28, 2020.
- From March 11, 2020, to April 8, 2020, the oil price crash further triggered the market sell-off, in both the equities and bond markets. The daily risk control mechanism began to reduce exposure to bonds, which helped to reduce losses.

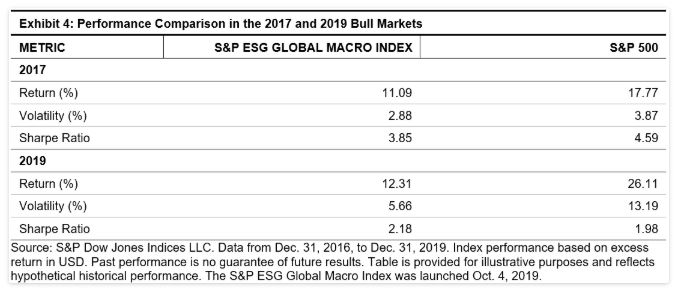
Scenario B: The Bull Markets in 2017 and 2019
In bull markets like those in 2017 and 2019, the S&P ESG Global Macro Index underperformed the S&P 500 ER. This comes as no surprise for a multi-asset index with a prudent volatility target. However, the index still delivered returns of 11.1% and 12.3% in 2017 and 2019, respectively, and with a higher Sharpe ratio than the S&P 500 ER in 2019.

The S&P ESG Global Macro Index aims to balance returns and risk in different market conditions. Historically, it has mitigated large losses from equities during bear markets while still delivering comparable Sharpe ratios during bull markets.
[1] The two-month U.S. dollar LIBOR interest rate and three-month U.S. dollar LIBOR interest rate are used to calculate the S&P 500 ER.
[2] The COVID-19 sell-off refers to the period from Feb. 19, 2020, to March 23, 2020, in the U.S. market; Feb. 19, 2020, to March 18, 2020, in the European market; and Feb 20, 2020, to March 16, 2020, in the Japanese market.
[3] The hypothetical portfolio allocates 60% to the equity basket (S&P 500 ESG Index, at 30%; S&P Europe 350 ESG Index, at 20%; and S&P Japan 500 ESG, at 10%) and 40% to the bond basket (S&P 10-Year U.S. Treasury Note Futures Index, at 20%; S&P Euro-Bund Futures Index, at 13.33%; and S&P 10-Year JGB Futures Index, at 6.67%), and it is rebalanced monthly. A 5% daily risk control overlay is applied.
