By Sophie Chinchilla, DWS
Sometimes, going back to the basics of economic theory is the best way to think about investment decisions. Since the beginning of October, unrest has dominated the market causing investors to re-think their riskier investments, including high yield bonds. However, there are some technical factors to consider that support the High Yield market. A simple supply shortage in the high yield universe can explain why, all else equal, the supply-demand dynamic may support spreads tightening.
The supply and demand curve has tormented first-year economics students for decades. But indulge me for a bit while I go back to the basics. The two most important curves in macroeconomics are the supply and the demand curves. Reading graph one is relatively straightforward: price and quantity for good ‘A’ will converge to the point where both curves meet. That is called equilibrium price, which is the most efficient arrangement. Market equilibrium can change if there is a shift in either of the curves. For example, all else equal, changes in the size of the market for good ‘A’ can cause the supply curve to move right (excess) or left (shortage). Notice the equilibrium price increases when there is a shortage. It’s a simple law of supply and demand.

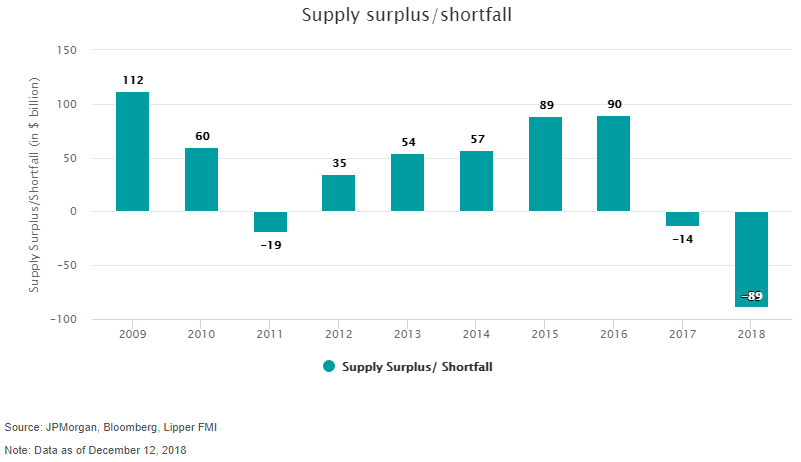
Rarely do real world situations works out as clearly as in economics textbooks. Luckily, the high yield market seems to be following the supply and demand law, at least as of late. In the past decade, there have only been two other high yield bond supply shortages, in 2011 and 2017 (graph 2) and both produced solid returns for investors. In 2011, the total return of the high yield corporate index was 5.0% and in 2017, 7.5%.1 This could bode well for investors heading into 2019, as last year’s supply shortage surpasses both of these previous shortages combined!
Why the fall in issuance?
It is interesting to examine why there are fewer high yield bonds being issued. It is arguably a combination of less than average new issuances and more bonds being called (graph 3 below). The average gross new issuance of the past decade was $295 billion per year. However, in 2018 there was only roughly $187 billion in gross new issuance.
Why do we see less gross new issuances despite all data indicating a strong economy and lower default rates?2 There are a couple of potential explanations. First, I’m afraid we have to bring up the go-to expression of the year: rising rates. As rates increase, it becomes more expensive for entities to issue new debt. If the Fed keeps hiking rates, this disincentive to borrowing can continue.
