After a long slumber of low volatility, markets are finally starting to wake up to kick off 2020. Concerns over the coronavirus are beginning to impact a variety of key industries, and global growth prospects are starting to take a hit as well.
As a result, many have been selling off equities and investors are seeing their first daily losses in excess of 1% for the S&P 500 and other key benchmarks in quite some time. And with worries over coronavirus and global growth expected to continue, it may be time to consider some lower volatility options that have proven their ability to hold up comparatively well during bouts of market turmoil.
One such asset class that has developed a lower volatility reputation over time is real assets. As represented by the DWS Real Assets Blended Benchmark, real assets have historically demonstrated an ability to post lower drawdowns when broad equity benchmarks are struggling.[1] As shown in the chart below, in each of the last four periods of market turmoil, the blended real assets benchmark—which includes commodities, infrastructure, REITs, Global Natural Resources and TIPS—was able to weather the storm better than either domestic or global equities:
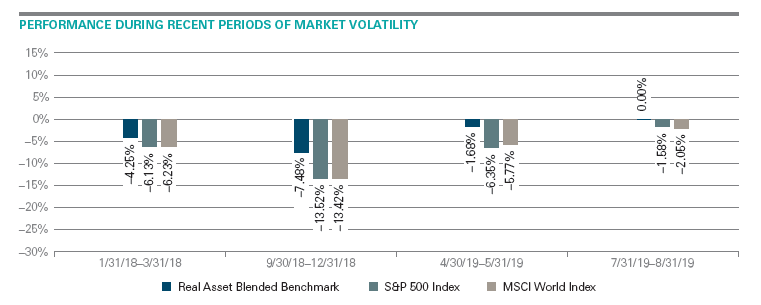
Source: Morningstar as of 12/31/2019. Past performance is not indicative of future results. See last page for standardized performance. Real asset blended benchmark: 30% Dow Jones Brookfield Global Infrastructure Index; 30% FTSE EPRA/NAREIT Developed Index; 15% Bloomberg Commodity Index; 15% S&P Global Natural Resources Index: 10% Bloomberg Barclays U.S. Treasury Inflation Notes Index.
What is particularly interesting about the periods outlined above is the diversity of situations for the market during the given time frames. Early 2018 featured rising interest rates while May 2019 saw interest rates tumble. Late 2018 experienced falling oil prices while August 2019 faced macroeconomic concerns on a global scale. However, despite the variety, a real asset blend was able to outperform on a relative basis in all of these environments.
Longer-term track record
This is not just a story of relatively solid performances when faced with a handful of periods of market turmoil, as a real assets blend has held up well across longer time frames as well. In the past five years, a blended real assets benchmark had a beta of 0.60 against the MSCI World Index, while it posted a downside capture ratio of just 56.03% against the same benchmark.
It has clearly offered investors a history of moving with less volatility than the broader equity market, and losing less during times of market turmoil as well. Add in attractive income potential and the possibility of more capital appreciation than what investors often see in the fixed income world, and a blend of real assets could be an intriguing option for investors, particularly with today’s increasingly rocky economic outlook.
Bottom line
In a number of tough situations, a blend of real assets have proven their mettle. For recent history, it didn’t matter if it was rising rates or recessionary fears, perilous economic environments impacted real assets less than the market at large.
Given the rising fears today of a slowdown and the uncertainty that may come from a little-known virus that is spreading the globe, it may be time to give real assets a closer look as a way to potentially dampen the impact from volatility during this difficult time.
1. Real asset blended benchmark: 30% Dow Jones Brookfield Global Infrastructure Index; 30% FTSE EPRA/NAREIT Developed Index; 15% Bloomberg Commodity Index; 15% S&P Global Natural Resources Index; 10% Bloomberg Barclays U.S. Treasury Inflation Notes Index.
