By Eric Legunn, CFA, DWS
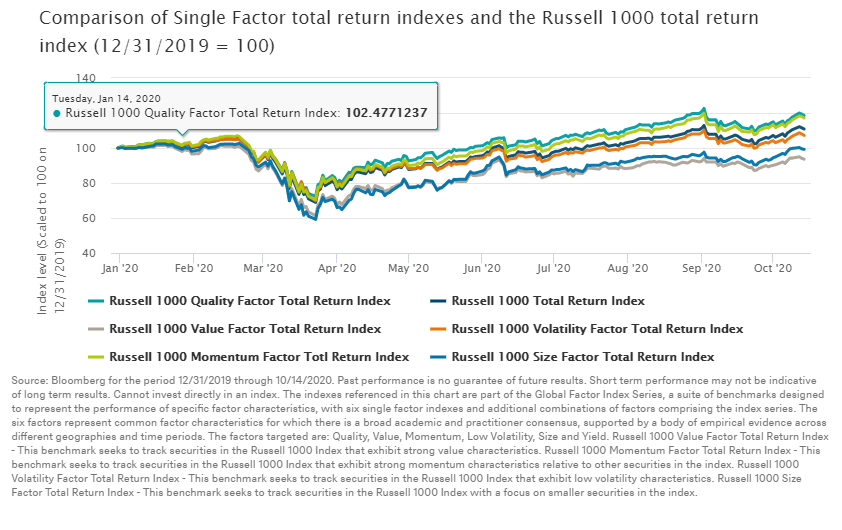
Previously, I wrote a blog to help investors better understand the quality factor. As shown below, year-to-date the Russell 1000 Quality Factor Total Return Index has outperformed not only the Russell 1000 Total Return Index, but also the Russell 1000 Value, Size, Volatility and Momentum Factor Total Return Indexes. This is a noteworthy result that deserves attention. So, today I would like to revisit the quality factor to explain how it aims to pick individual securities within a smart-beta exchange traded fund (ETF).
What is the quality factor? Definitions for quality vary across the investment industry. At DWS, we partner with FTSE Russell to define the quality factor in terms of high and persistent profitability in conjunction with low leverage. When it comes to profitability the quality factor assesses a company’s return on assets (ROA), change in asset turnover (CTO), and level of accruals (ACCR). These three metrics gauge both the level and persistence of a company’s profitability. On the other hand, a ratio of operating cash flow to total debt is used to assess a company’s leverage. In a typical application of the quality factor, these metrics are calculated for all 1000 companies in the Russell 1000 and an overall quality score is calculated for each security. The quality score is calculated using a 50% emphasis on profitability (which is further subdivided into equal 33% weightings on ROA, CTO, and ACCR) and a 50% emphasis on leverage. Companies that exhibit the highest quality scores are more heavily weighted in a portfolio that aims to capture the quality factor, while companies that exhibit the lowest quality scores are least heavily weighted. To gain a better understanding of this, let’s take a look at an example that compares two hypothetical companies from a quality standpoint: brand-name Company X and unknown Company Y. The quality factor compares these two companies on the basis of ROA, CTO, ACCR, and leverage. Consider Company X and Company Y. How does the quality factor choose which one to overweight or underweight in our portfolio? Table 1 lists financial data for these companies:
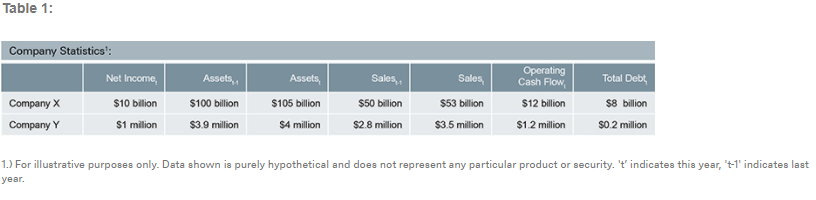
Company X is a multi-billion dollar market-cap company that has operations in over forty countries, revenues that reach over fifty billion dollars per year, and over 100 billion dollars in assets. When compared to Company Y, which is a mere multi-million dollar market-cap company that has small operations (perhaps in the state of New Jersey!), millions in revenue per year, and only a few million dollars of assets, Company X may at first look like the better investment to include in your portfolio. However, let’s level the playing field and consider quality, not quantity. This is how the quality factor works. It uses ratios to compare companies on a size-adjusted basis so that it can better evaluate the financial picture of each company in the context of critical questions such as: Which company is more profitable? Which company has less debt relative to the size of its cash flow stream? Which company is more efficiently generating sales from its assets over time? These questions change the way in which we compare Company X and Company Y. Table 2 shows the ROA, CTO, and leverage for Company X and Company Y, and for simplicity does not include ACCR.
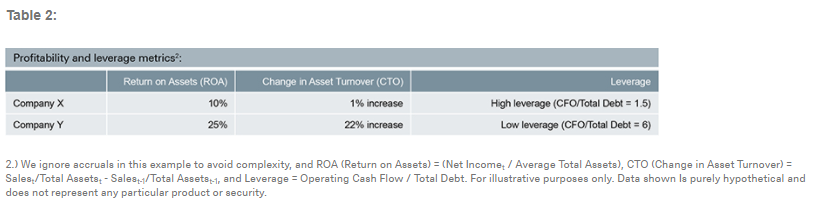
Here, we gain an entirely different perspective on Company X and Company Y. After adjusting for size, it seems that Company Y is vastly superior to Company X from a quality standpoint. Company Y is more profitable, more efficient, and has lower leverage than Company X. With an ROA of 25%, Company Y earns two-and-a-half times more dollars of earnings per dollar of assets than Company X, which has an ROA of only 10%. Furthermore, with a 22% year-over-year increase in asset turnover, it seems that Company Y was able to more drastically improve its efficiency when compared to Company X, which only saw a 1% increase in asset turnover. In other words, Company Y is finding ways to increase the dollar amount of sales it generates per dollar of assets at a faster rate than Company X—a positive signal for Company Y’s future profitability. Lastly, relative to Company X, Company Y has a far lower level of leverage (and therefore potentially lower level of risk). Company X’s annual cash flow from operations is only 1.5 times the amount of debt that it carries, while Company Y’s cash flow from operations is 6 times the amount of debt that it carries. In other words, Company Y would generate enough cash flow from operations to pay off all of its debt in only two months of normal business activity, while it would take Company X four times longer, or eight months to do so.
Which company would you pick? The quality factor overweights Company Y, and this is precisely why we believe that it is important for smart-beta strategies to have exposure to this factor and why we include it in our multi-factor ETFs. We hope that through these examples we have given you a better understanding of the quality factor and that it will help you make more informed decisions when considering factor investing. More on factor investing can be found on our dedicated factor investing website
If you would like to receive future Xtrackers blog posts please subscribe
Originally published by DWS, 10/15/20
Important Risk Information
This website is intended to be a general communication and is provided for informational and/or educational purposes only. None of the content should be viewed as a suggestion that you take or refrain from taking any action nor as a recommendation for any specific investment product, strategy, plan feature or other such purpose. Your use of this website indicates that you agree with the intended purpose. Prior to making any investment or financial decision, you should seek individualized advice from a personal financial, tax, and other professionals who are able to provide advice in the context of your particular financial situation.
Investments in mutual funds involve risk. Stocks may decline in value. Bond investments are subject to interest-rate and credit risks. When interest rates rise, bond prices generally fall. Credit risk refers to the ability of an issuer to make timely payments of principal and interest. Investing in derivatives entails special risks relating to liquidity, leverage and credit that may reduce returns and/or increased volatility. Investing in foreign securities, particularly those of emerging markets, presents certain risks, such as currency fluctuations, political and economic changes, and market risks. There are additional risks associated with investing in commodities, high-yield bonds, aggressive growth stocks, non-diversified/ concentrated funds and small- and mid-cap stocks which are more fully explained in the prospectuses. Please read the prospectus for more information.
You cannot invest directly in an index. Shares of exchange traded funds (ETFs) are bought and sold at market price (not NAV) throughout the day on the New York Stock Exchange. There can be no assurance that an active trading market for shares of a fund will develop or be maintained. Transactions in shares of ETFs will result in Brokerage commissions and will generate tax consequences. There are risks associated with investing, including possible loss of principal. Stocks may decline in value. Bonds are subject to interest rate, credit, liquidity and market risks to varying degrees.
Foreign investing involves currency, political and economic risk. Funds focusing on a single country, sector and/or funds that emphasize investments in smaller companies may experience greater price volatility. Investments in emerging markets, real estate, currency, fixed income and alternative investments include additional risks. Due to the investment strategy of certain Funds, they may make higher capital gain distributions than other ETFs. Please see the fund’s prospectus for a complete discussion of risks.
Shares of the exchange traded funds may be sold throughout the day on the exchange through any brokerage account. However, shares may only be purchased and redeemed directly from the funds by authorized participants in very large creation/redemption units. There is no assurance that an active trading market for shares of an exchange traded fund will develop or be maintained.
MSCI and MSCI Index are servicemarks of MSCI Inc. and have been licensed for use by db-X. The ETFs are not sponsored, endorsed, issued, sold or promoted by MSCI Inc. nor does this company make any representation regarding the advisability of investing in the ETFs. Index data source: MSCI Inc.
DWS investment products offered through DWS Distributors, Inc. Advisory services offered through DWS Investment Management Americas Inc. Xtrackers ETFs (“ETFs”) are managed by DBX Advisors LLC (the “Adviser”), and distributed by ALPS Distributors, Inc. (“ALPS”). The Adviser is a subsidiary of DWS Group GmbH & Co. KGaA, and is not affiliated with ALPS.
View our privacy policy, legal information and security statement.
Obtain A Prospectus
Carefully consider the fund’s investment objectives, risk factors, changes and expenses before investing. This and other information can be found in the fund’s prospectus. To obtain a mutual fund summary prospectus, if available, or prospectus, call (800) 728-3337 or download one from fundsus.dws.com. To obtain an ETF prospectus call (855) 329-3837 or download one from etf.dws.com. To obtain the RREEF Property Trust prospectus, download one from rreefpropertytrust.com. Read the prospectus carefully before investing.
Not FDIC/NCUA insured. May lose value. No bank guarantee. Not a deposit. Not insured by any federal government agency.
The brand DWS represents DWS Group GmbH & Co. KGaA and any of its subsidiaries such as DWS Distributors, Inc., which offers investment products, or DWS Investment Management Americas, Inc. and RREEF America L.L.C., which offer advisory services.
DWS Distributors, Inc. Member FINRA
