Myth 5: The ETF Tail is Wagging the Asset Dog – What is the difference between, and importance of, primary and secondary liquidity in both highly liquid, and relatively illiquid markets? How is it possible to have often vast amounts of secondary market trading of an asset (class) that is itself potentially not being traded (or at least traded far less). Are ETFs simply derivatives?
It is important to remember that ETFs are one of many tools investors can use to implement their market views. Ultimately, prices of underlying securities are freely formed by market dynamics of supply and demand, and the price of an ETF simply reflects these underlying market dynamics as well. The mechanism of creating and redeeming ETFs by APs effectively transfers the true cost of transacting in the market onto ETF investors. Because this is true, generally speaking, ETFs can provide investors liquidity commensurate with the underlying risk markets even if the ETFs themselves do not frequently trade. In fact, ETFs can go one step further and provide liquidity even when the underlying market fails. An example of this occurred from 6/26/15 to 7/31/15 (indicated by the grey shaded area in the chart below). At this time, the Greek stock market closed but the largest, most-liquid, Greece ETF continued trading in the United States, which provided investors with the ability to access the Greek market even when the underlying securities were not trading.
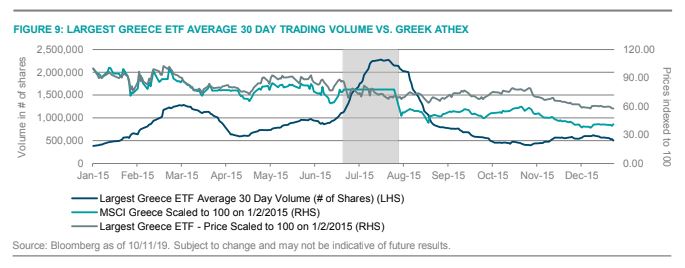
As you can see, trading volume in the Greece ETF spiked even when the Greek market was closed, which speaks to the flexibility and additional liquidity that ETFs provide market participants. A similar example occurred in Egypt from January 27, 2011, to March 23, 2011, when the Egyptian market was closed due to the Arab Spring.
Unlike an individual stock, the liquidity of an ETF is not limited to the number of existing shares available in an ETF’s secondary market. Instead, the liquidity is determined by how easy it is to create or redeem the underlying basket in the open cash market. This is commonly measured by market participants in the form of “implied liquidity” (for more, see the below box). In all cases, regardless of size, the secondary market of an ETF adds additional layers of liquidity. In general, the liquidity buffer provided by ETFs and ETPs can be observed by measuring secondary market turnover relative to primary market turnover. Across the U.S. ETF market, for example, the secondary to primary market ratio is was 7.7x on average over the past 5 years, which highlights the additional liquidity buffer ETFs add that can help reduce the impact on underlying securities.
Capitals Markets
- Implied liquidity refers to the number of shares that can be created/redeemed before materially moving the price of a security. This is typically measured by 25% of the 30-day average volume of the least liquid security in the basket. In the case that the required execution volume exceeds the implied liquidity figure, clients can work with the Capital Markets team to ensure best or more efficient execution
- Using limit orders rather than market orders can mitigate execution risk during periods of market stress
- Large trades in international ETFs are typically better suited for times when the underlying markets are also open (e.g. MSCI World has over 60% US Exposure; thus, waiting for the US market to open would likely resulted in better execution)
- Time of day matters for market impact—the most liquid part of the day (as defined by the largest number of trades taking place) typically occurs going into the market
As the secondary market for the ETF grows, its liquidity improves, allowing investors to rely more on the availability of existing ETF shares rather than having to tap the primary cash markets via the creation and redemption process. In fact, ETFs with large secondary markets frequently have Iower trading costs than their underlying basket, particularly when the underlying basket rarely trades. The development of these secondary markets provides an additional layer of liquidity on top of the underlying cash market, which allows the ETF to potentially trade without having a major impact on its underlying basket. For this reason, ETFs with large secondary markets are often used as a primary trading vehicle, particularly when the underlying cash market is relatively illiquid.
In relatively illiquid markets, this transfer of the fluidity of trading from the underlying market should also be reflected in the way ETFs will price relative to their underlying baskets. As mentioned earlier in the paper, APs are often able to utilize a wide variety of financial instruments (e.g. futures, swaps, underlying basket, other ETFs, options) in order to hedge their risks, thus supplying additional levers for more efficient ETF market pricing.
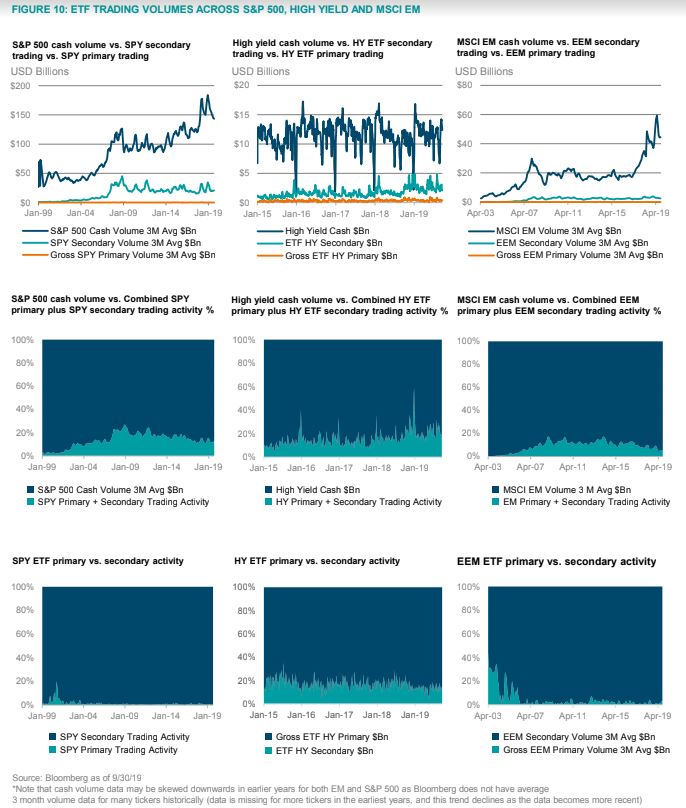
The following exhibits explore the relationship between ETF secondary trading activity, primary market trading activity (i.e. creates and redeems), and underlying market trading activity across three markets, and the results are telling.
The exhibits show that ETF primary volume makes up only a tiny percentage of cash trading volume across a variety of markets, namely the S&P 500, the US High Yield Corporate Bond market, and emerging market equities over time, and secondary volumes are still small (and even potentially declining) as a percentage of overall cash volumes. Looking at the middle row of exhibits, one can see that for the S&P 500 and also for emerging markets, combined primary and secondary ETF activity appears to be on the decline as a percentage of total cash volume. Shown differently, in the first row of exhibits, one can see that both in EM and in the S&P 500, cash volumes have been rising at a faster pace than ETF primary and secondary activity. For high yield
bonds, primary and secondary ETF activity is drifting higher, but this is only a slight trend, and primary plus secondary ETF activity still represents a small fraction of cash market volume. Across all three markets, it appears that ETF primary market activity is extremely small on a percentage basis, relative to ETF secondary market activity (as seen in the third row of exhibits). This speaks to the minimal impact that ETFs can be expected to have on the underlying cash market.
Visually, based on the third row of exhibits, one can see how small of a percentage ETF primary activity represents, relative to ETF secondary activity. This could imply that even if total ETF AUM were to double or triple from today’s levels, the impact that ETFs have on underlying markets would still likely be minimal, as nearly all of their trading activity occurs on a secondary level without buying or selling underlying securities.