Myth 3: ETFs are dangerous tools in unsafe hands – Has the ease and increase of ETF trading (and passive generally) created a bubble in markets from naïve flows buying all stocks? Has it led to people overtrading, or speculating, in markets (sometimes illiquid markets) they may not understand?
Market bubble?
If flow simply represents a shift of assets from active to passive, then the net effect on the market should be marginal—money is simply being re-allocated, not introduced. If the flow represents net new assets (NNA), then all else equal, higher demand for ETFs should lead to higher demand for individual securities in those ETFs’ underlying markets, which in turn should lead to higher asset prices—higher prices do not necessarily indicate a bubble if they are justified (i.e. consider the interest rate environment and whether fundamentals have been improving).
Notably, the exhibit below does not clearly evidence that the S&P 500 is in a bubble. In Figure 7, examining the S&P 500 price to free cash flow ratio as a measure of valuation, there is no obvious increase in valuations over the past 20 years.
In fact, we are currently trading at a similar valuation to the long term average in spite of the significant flows driven into the S&P 500 via ETFs and other index products.
Speculation, overtrading?
Anyone can buy a stock, capital markets do not require justification. But, the real questions are: have ETFs enabled additional speculation and overtrading? Can overtrading even be evidenced? If so, does trading activity need to be normalized by number of listings, or market cap?
If ETFs have enabled speculation, they have also given investors significant advantages, such as accessing an entire market in one trade. In the following exercise we aim to get a sense for how a particular segment of the market behaved when large inflows into a popular ETF that tracks that segment of the market occurred. Figure 8 shows the dollar inflow into a large minimum-volatility ETF that, in our opinion, serves as a good proxy for the minimum-volatility segment of the U.S. stock market.

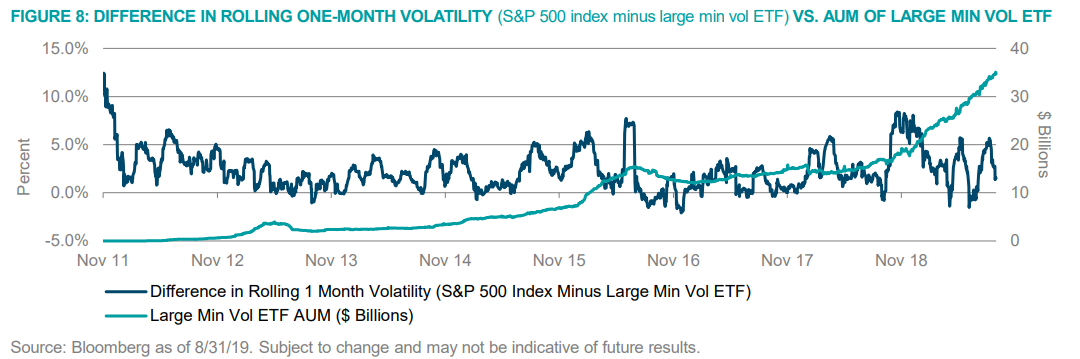
As you can see, there appears to be no immediately noticeable trend that links large inflows into the minimum volatility segment of the market with the observed volatility difference between the broad U.S. stock market (represented by the S&P 500) and the minimum volatility segment of the U.S. stock market (represented by the large min vol ETF). In fact, the relationship seems to be relatively stable across the minimum volatility segment of the market, as the approximately nine-year period charted shows that the volatility difference between the S&P 500 and min vol hovered between 0.0% and 6.0% most of the time.
This is not definitive proof, but provides evidence in support of the fact that as ETF AUM rises, it does not necessarily change the volatility profile of the segment of the market that underlies that particular ETF, relative to the broad stock market.
