By Borealis Global Advisory LLC
Lack of A Valuation Metric to Evaluate Countries for the Medium Term
To express forward-looking equity outlooks of individual countries using top-down valuation methods, managers and analysts alike use, apart from macroeconomic factors, the same fundamental metrics they use to screen individual stocks like the price-to-earnings ratio, the price-tosales ratio, the dividend yield, and the enterprise-value-to-EBITDA ratio, to name a few. Most of the outlooks derived from these metrics give investors a glimpse of how the country equity markets may perform in the short-term. However, there is definitely a lack of a unified metric that expresses the medium-term (three to eight years’ time frame) return expectations of a country equity market and that can be an addition to the toolbox for screening countries for country allocation while developing an international equity portfolio. Unified? Unified in the sense the metric should capture both the valuation of a country and its price return momentum.
Modifying CAPE (or Shiller’s PE) to Develop a New Country Yield Forecast Measure CY-M
In order to develop this unified metric, a yield forecast measure, which we call medium-term country yield forecast (CY-M), we explored many models to adapt CAPE (popularly known as Shiller’s PE) in order to derive the medium-term real returns expectations of national equity markets underlying the MSCI All Country World Index ex. USA (ACWX). CAPE, though originally derived for the US equity market, has now been calculated for various national equity markets, and in all its variations, the measure has been used only to express the valuations of those markets in terms of overvalued, undervalued, or fairly valued. However, none of those adaptations of the measure have been used to derive a finite equity return expectations of those markets. In almost all of its adaptations, CAPE has mostly been used to express only long-term (greater than 10 years) return expectations of the equity markets, but in our models, we have explored its application in expressing the medium term (between two and 10 years) return expectations.
How to Develop the New Country Valuation Metric CY-M?
While exploring the various models to develop CY-M, using a modified version of CAPE, we undertook an empirical study of the national equity markets underlying ACWX for the period 1969 thru 2017. In doing so, we identified various measures that could be coalesced into CAPE. In our empirical analysis and modeling, we departed from the usual price-multiple expression of CAPE by inverting the CAPE of each national market to its yield expression form, called inverse CAPE ( INV.CAPE), as the latter is more intuitive for investors to grasp. Why? It’s easier to explain a negative yield than a negative PE. In our analysis, we used rolling forward real (adjusted for inflation) returns over two-year through nine-year time horizons, all expressed in compound annual growth rate (CAGR) basis.
Cyclically Adjusted Real Exchange Rate
Among the measures we identified that could coalesce into CAPE, we found cyclically adjusted real exchange rate (RER 10) and trailing five-year price return momentum of national markets to have significant influence over their forward returns. The rationale for using the real exchange rate is intuitive – export-oriented economies depends on the relative price of export goods and services in the international market. The relative price of an exported good or service is a function of its native price and the exporting country’s nominal exchange rate, inflation level, and its long-run productivity. The real exchange rate, which encapsulates these factors into a single measure, is therefore potentially, albeit indirectly, the major driver of medium-term earnings of national equity markets.
Five-Year Price Return Momentum
The inspiration to coalesce trailing five-year price return momentum (5-YR MoM) with CAPE is based on findings put forth by DeBondt and Thaler in the paper “Does the stock market overreact?” In this paper, DeBondt and Thaler examined the future returns of past long-term outperforming and under-performing US stocks, where the out-performers and under-performers are measured using look-back windows ranging from three to five years, and concluded that performance of underperformers exceeds that of the outperformers. Zaremba explored the same idea with national equity markets in his paper “Investor Sentiment, Limits on Arbitrage, and the Performance of Cross-country Stock Market Anomalies.”, and he discovered that the phenomenon of long-term return reversal could be employed at the country level as well.
S-CAPE (Smart CAPE) Good Predictor of CY-M
Statistical analysis of the forward returns of countries underlying ACWX across the selected periods and their respective measures – INV. CAPE, RER 10, and 5-YR MoM – reveals that by blending RER 10 and 5-YR MoM with INV.CAPE we can define a smarter version of CAPE, called S-CAPE (Smart CAPE), which we discovered is a sound, robust measure that captures the medium-term returns expectations of any country outside the US. The analysis also discloses SCAPE, the modified version of CAPE, is reasonably a very good predictor of CY-M, the expected annual real equity returns (on a CAGR basis) over successive eight years, for all countries, both developed and emerging, in the index. Back-testing of international country rotation portfolios developed by selecting countries with high CY-Ms have yielded higher risk-adjusted alpha.
The Plot of CY-M for Japan
Let us look at Exhibit 1, which plots the trend of Japan’s CY-M over time. Along the bottom of the chart, the time periods advance on a monthly basis and the dates reflect the starting points of eight-year forecast time horizons, while the dates along the top reflect their respective endpoints. The vertical grid lines in the chart link together the ends of forecast horizon periods. Any point on the line chart is the compound average annual real return forecast for the succeeding eight years starting from the date listed on the bottom of the grid line and ending on the date listed on the top of the grid line. For example, as you can read from the exhibit, at the end of January 2018, CY-M for Japan is 9.57%, which means for the period starting from the end of January 2018 thru the end of January 2026, the expected real returns from the Japanese equity market is 9.57%. To summarize, this chart depicts the rolling forward compounded average annual equity-performance expectations (across eight-year intervals) of Japan on an inflation-adjusted basis, giving the investors a broad strategic cue on how to allocate to Japan in their international equity portfolios. This illustrative outline helps us understand how to frame equity expectations through CY-M at the country level.
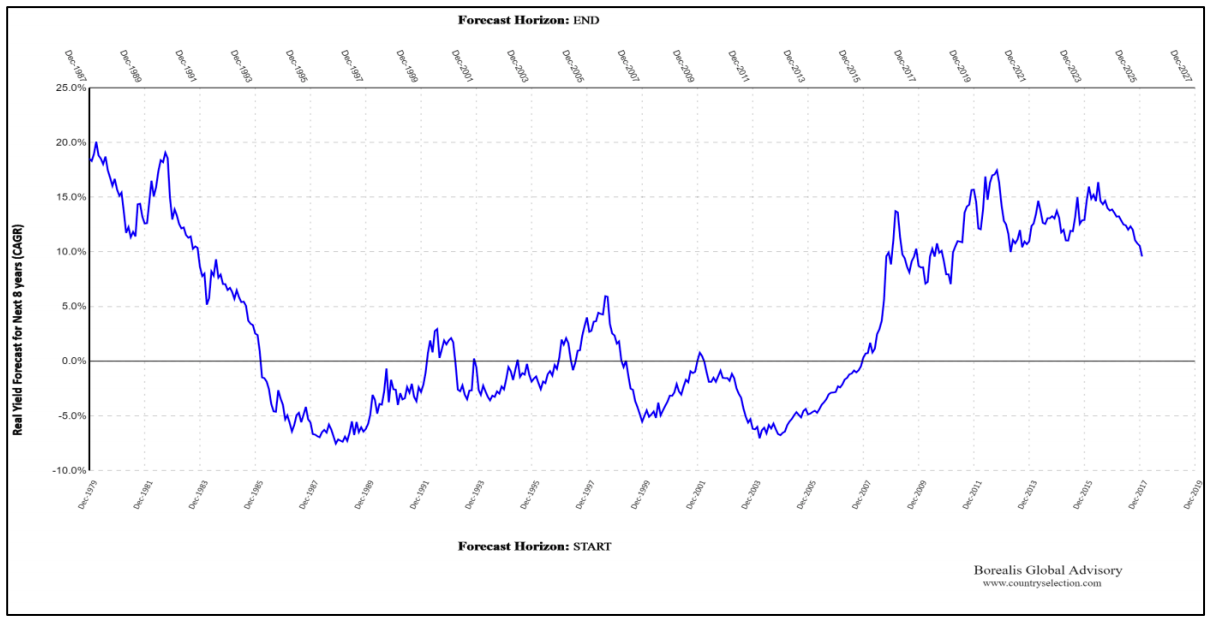
Exhibit 1: Medium-term country yield forecast (CY-M), Japan
Source: BGA calculations, MSCI, and IMF.
Notes: Data runs through January, 2018. The vertical lines indicate the forecast horizons, starting from the dates listed on the bottom x-axis and ending on the dates listed on the top x-axis. The country yield forecast model used is as of end of July, 2018.
Country Rankings
Here is the latest list of top two quintile countries ranked by CY-M:
Quintile 1
Argentina, Colombia, Finland, Peru, Egypt, Indonesia, Spain, Japan, Israel, Czech Republic
Quintile 2
Thailand, Malaysia, Austria, France, Sweden, Morocco, Turkey, Italy, Denmark
Further details, visit the following
Dashboard:
www.countryselection.com/enhancedcape
Publications:
A Yield Measure for Country Selection in the Medium Term Using Shiller’s PE
International Equity Investing: What is the best measure for country selection in the medium term?
For more market trends, visit ETF Trends.
