Currencies are notoriously difficult to predict over short time frames.
The foreign exchange (forex) market sees an incredible level of turnover on a daily basis, huge volumes, and is subject to a number of political and economic factors. Combine that with leverage and a 24-hour trading day, and investors have a recipe for uncertainty.
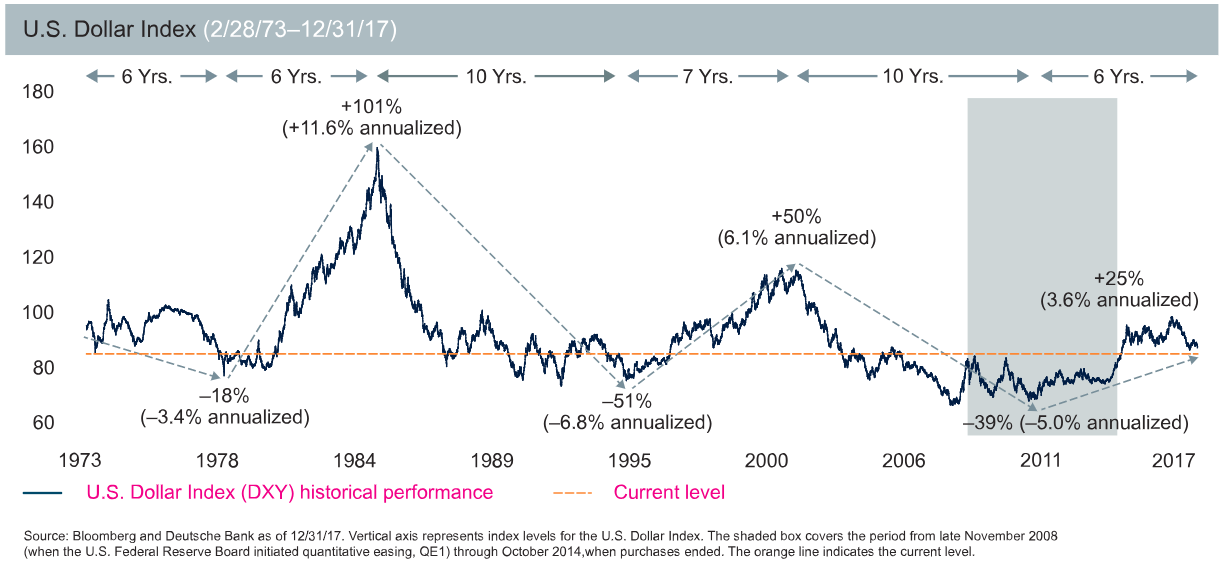
However, as volatile and random as currencies can be in the short-term, they are surprisingly trend-following over time periods lasting several years, at least from a historical perspective. Since 1973, the U.S. dollar has been relatively cyclical with runs of, on average, eight years, excluding the current cycle. Even if you include the current time frame, we haven’t seen a bull or bear period for the dollar that was less than six years long, underscoring just how durable trends can be in the currency market.
And it isn’t as though these periods have been marked by mild gains or losses either. The most extreme bull run produced a gain of more than 100% for the U.S. dollar index, including 11.6% annualized returns. Meanwhile, on the bear side, a 10-year slump saw a 51% decline, or a roughly 6.8% annualized loss.
Though lengthy and potent runs have been the norm, it is important to note the long-term impact of these currency movements and how the dollar’s performance overall since the collapse of the Bretton Woods Agreement betrays shorter-term volatility and trends. The dollar index is roughly unchanged since the 70’s when the agreement fell apart, nullifying the impact of those runs for any investor who held on long enough, or did not have incredible timing.
![]()
Bottom Line
Over a long enough time frame, currencies tend to mean revert. In other words, even though they tend to go on lengthy runs, there is a certain gravity to the market that tends to pull currencies back to the mean, at least if one waits long enough.
