Despite earlier incarnations, a reasonable date for the euro’s actual birthday is 1st January 1999 when it became fully usable and tradable (though the physical notes and coins didn’t appear until 1st January 2002). And, for a currency that has only just entered into adulthood, it’s fair to say that it is punching above its weight – according to the Bank for International Settlements’ 2016 Triennial Survey of FX, more than 30% of all over-the-counter FX transactions involve the single currency, making it the second most important currency in the world behind the venerable US dollar.
But, global heft aside, the question for a US investor around this key birthday is: has the euro been a jolly good fellow; or, paraphrasing, how beneficial has holding the euro been? For those that have accessed euro-denominated assets – be they stocks, bonds, or real estate – and elected not to hedge out their currency exposure, what has been the impact of that decision? The euro may have (so far) proved its chops at surviving various crises, but has it, and can it, prove its chops at justifying a place in a US investor’s portfolio?
In our view, this question is best answered through an examination of the four key metrics that matter when considering the role that international currency plays in a portfolio. These metrics are:
- Return – The extent to which a long position in the currency has helped a US investor.
- Risk – The extent to which the currency has exhibited volatility, and how that has changed the risk of the portfolio.
- Correlation – Linked to risk, the way in which the currency has moved vis-à-vis the international asset, and the impact that has on overall portfolio volatility.
- Hedging Costs – The cost, or benefit, that has accrued to a US investor to hold, or remove, the euro.
Return
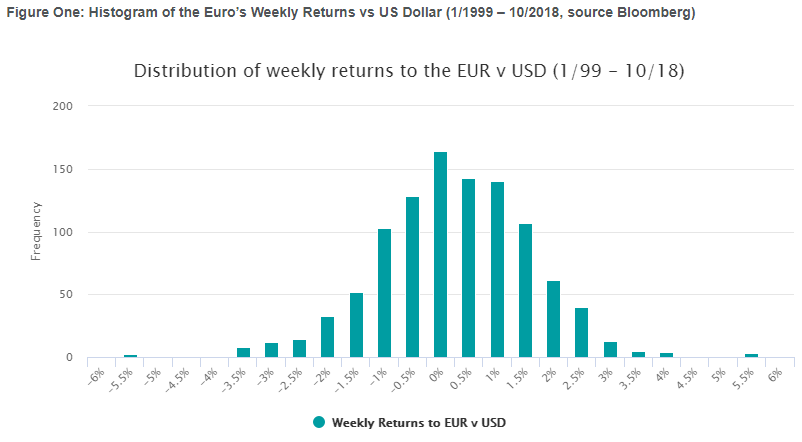
At the time of writing, the euro has had 1,034 weekly returns, and Figure One shows the histogram of all of them. Here is our take on the broad conclusions that an investor could draw when looking at this return data for the euro:
- The weekly returns are essentially normally distributed with a mean of 0.01% and a weekly standard deviation of 1.37% (annualized to 9.87%).
- The mean weekly return is not statistically significantly different from zero, and there have been an almost identical number of up weeks (517) as there have down (514), with a few flat (3).
Figure One: Histogram of the Euro’s Weekly Returns vs US Dollar (1/1999 – 10/2018, source Bloomberg)
Risk
So if it’s fair to say that the weekly returns to the euro have been mean zero, and therefore not particularly helped a US investor, the next obvious question is, how can that have hurt? And, the answer of course lies in return’s, often overlooked, partner – risk.
