
![]()
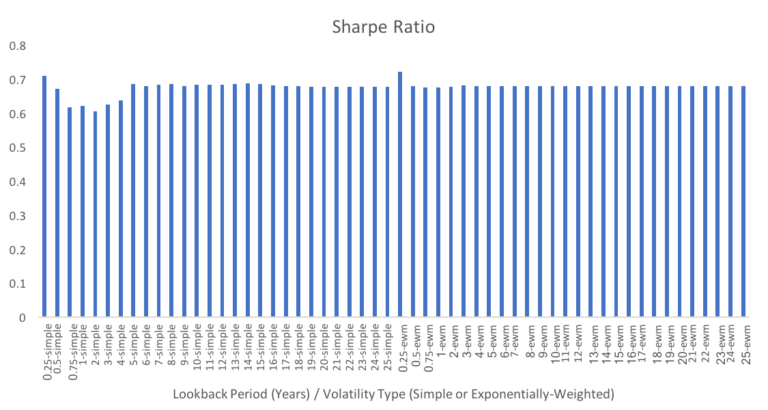
Data Source: CSI. Calculations by Newfound Research. Risk parity indices are backtested and hypothetical and do not reflect any strategies managed historically by Newfound Research. Returns do not include and fees or expenses and include the impact of dividend reinvestment. Indices are used as proxies for ETFs prior to launch when necessary. Results cover the period from December 1999 to November 2017. Past performance does not guarantee future results. Sharpe Ratios calculated using daily data that is annualized.
We do see slightly more significant outperformance for shorter lookbacks when we evaluate the strategies using their alpha relative to a 60/40 U.S. stock/U.S. bond benchmark. For example, the 1-quarter exponentially-weighted lookback has annualized alpha of 6.0% versus a median of 4.8% across all exponentially-weighted lookbacks.
From a risk perspective, performance is likewise pretty clustered. The maximum drawdown across all strategies tested ranges from 25% to 31%. We do see somewhat better risk mitigation for shorter, especially shorter exponentially-weighted, lookbacks.
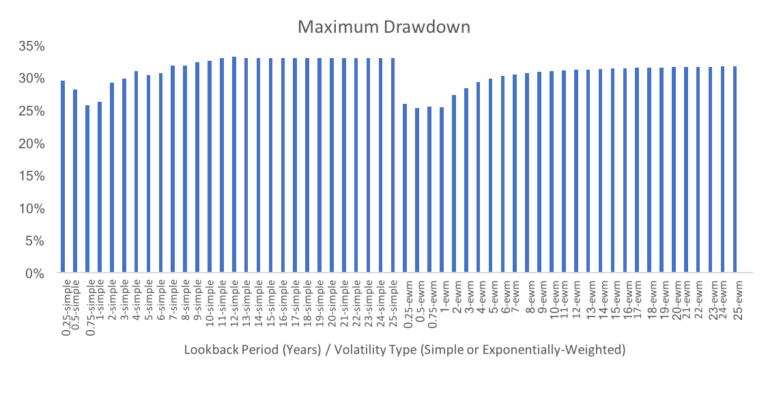
Data Source: CSI. Calculations by Newfound Research. Risk parity indices are backtested and hypothetical and do not reflect any strategies managed historically by Newfound Research. Returns do not include and fees or expenses and include the impact of dividend reinvestment. Indices are used as proxies for ETFs prior to launch when necessary. Results cover the period from December 1999 to November 2017. Past performance does not guarantee future results. Maximum drawdown calculated using monthly returns.
Evaluating the Objective
As we stated above, we built the simple risk parity strategies to target a 10% volatility level. Therefore, we can also evaluate the strategies based upon how they delivered on this risk objective, both on average across the whole period and through time.
The next chart graphs the annualized volatility for each of the strategies relative to the 10% target. We see that both of the shortest lookback period strategies overshoot the target by more than 1%. For both types of volatility measures, we generally see the strategies undershoot the volatility target for shorter lookbacks and overshoot it for longer lookbacks.
For reference, a 95% confidence interval for the annualized volatility would be approximately 9.8% to 10.2% or a difference of +/- 0.2%.
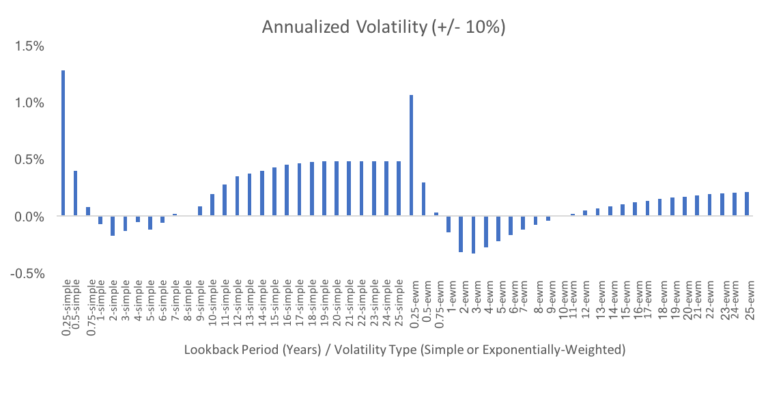
Data Source: CSI. Calculations by Newfound Research. Risk parity indices are backtested and hypothetical and do not reflect any strategies managed historically by Newfound Research. Returns do not include and fees or expenses and include the impact of dividend reinvestment. Indices are used as proxies for ETFs prior to launch when necessary. Results cover the period from December 1999 to November 2017. Past performance does not guarantee future results. Annualized volatility calculated using daily data.
We can also look at rolling volatilities through time. For simplicity, we will just look at the 0.25-ewm, 5-ewm, and 25-ewm portfolios. We will compare them to the rolling volatility for the 60/40 benchmark.
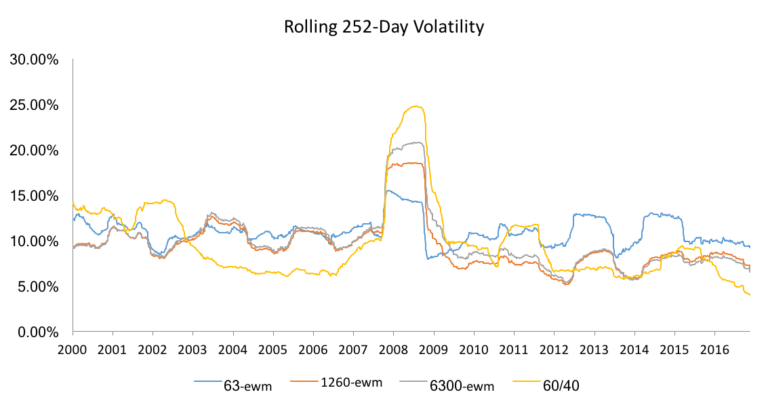
Data Source: CSI. Calculations by Newfound Research. Risk parity indices are backtested and hypothetical and do not reflect any strategies managed historically by Newfound Research. Returns do not include and fees or expenses and include the impact of dividend reinvestment. Indices are used as proxies for ETFs prior to launch when necessary. Results cover the period from December 1999 to November 2017. Past performance does not guarantee future results. Annualized volatility calculated using daily data.
All three risk-parity portfolios outperform the 60/40 when it comes to maintaining a relatively constant volatility. Comparing the different lookback periods, we see that shorter lookback periods generally do a better job.
Blending Signals
Based on the analysis so far, there is good news and bad news. The bad news is that there is no clear winner when it comes to the optimal lookback period. In the backtests, shorter lookback periods delivered better risk-adjusted performance and were more effective in delivering a consistent volatility profile. However, this came at a cost as these strategies experienced much higher turnover than their slower-reacting brethren. In addition, the shortest lookback periods were furthest from achieving the 10% target volatility over the full period.
The good news is that the overall results were very robust to the choice of lookback period. In other words, we don’t have to worry too much about selecting the “right” lookback period. No matter what we choose, we can be reasonably comfortable that we will capture the main features of the risk parity style.
In these types of scenarios, we typically favor blending multiple signals. There are a few ways we could do this. One would be to simply to pick a few different lookbacks, calculate each portfolio independently, and then average the portfolios together. For example, we could pick three lookbacks:
- A short lookback to maximize adaptability (i.e. a one-quarter lookback).
- A medium lookback to capture most of the market cycle, providing for more stable estimates while still allowing for longer term regime changes (i.e. a 5-year lookback).
- A long lookback to take into account as much information as we can (i.e. a 25-year lookback).
When we blend these three portfolios equally, we end up with a Sharpe Ratio of 0.71 compared to 0.72, 0.68, and 0.68 for the short, medium, and long-term lookbacks, respectively. Furthermore, we end up relatively close to the target volatility (10.2%) and much lower turnover than the short lookback period alone.

Data Source: CSI. Calculations by Newfound Research. Risk parity indices are backtested and hypothetical and do not reflect any strategies managed historically by Newfound Research. Returns do not include and fees or expenses and include the impact of dividend reinvestment. Indices are used as proxies for ETFs prior to launch when necessary. Results cover the period from December 1999 to November 2017. Past performance does not guarantee future results.
Areas for Additional Study
This is just the tip of the iceberg when it comes to exploring this topic. There is nearly endless literature on the topic of better volatility estimators alone. Other areas to look into include adaptive volatility measures that automatically adjust the lookback period over time[4] and the impact of lookback periods on alternative risk measures (e.g. value-at-risk, conditional value-at-risk, conditional drawdown-at-risk).
Conclusion
Risk parity portfolios attempt to diversify across asset classes and strategies by risk contribution as opposed to dollar allocation.
Implementing a risk parity strategy requires making a number of important construction decisions. One key question we have to answer is “How are we going to measure risk?” One approach is to use historical data to estimate risk. When using this approach, we have to decide how much historical data to use for the calculation. This parameter is often referred to as the lookback period.
We tested lookback periods ranging from one quarter to twenty-five years. We found that there was no clear winner. Shorter lookback periods delivered better risk-adjusted performance and were more effective in delivering a consistent volatility profile. However, this came at a cost as these strategies experienced much higher turnover than their slower-reacting brethren. In addition, the shortest lookback periods were furthest from achieving the 10% target volatility over the full period.
While this might appear frustrating at first, the results are in fact very good news. Risk parity is very robust to the choice of the lookback period. In other words, we don’t have to worry too much about selecting the “right” lookback period. No matter what we choose, we can be reasonably comfortable that we will capture the main features of the risk parity style. In these situations, a simple and effective approach is to use multiple lookback periods. We show that this type of blended approach can help to isolate the best attributes of both shorter and longer lookback periods.
[1] For one such argument, see Leverage Aversion and Risk Parity by Asness, Frazzini, and Pederson (2012) which can be found at https://www.aqr.com/library/journal-articles/leverage-aversion-and-risk-parity.
[2] As an example, consider the 63-day lookback period. The exponentially-weighted metrics were computed using alpha equal to 0.022 (or in RiskMetrics terminology a decay factor of 0.978). This leads to the exponentially-weighted volatilities having a half-life of 31.5 days.
[4] See here for an example from David Varadi.
