
Investing in emerging markets requires paying attention to trade, as the elevated levels of volatility and sensitivity to U.S.–China headlines place macro drivers at the forefront of the EM story, especially relative to developed markets.
While mixed headlines have and will almost assuredly continue to persist, recent developments regarding trade have been quite positive. Emerging markets have been a notable beneficiary of the path towards a resolution under both absolute and relative lenses.
LIGHT AT THE END OF THE TRADE TUNNEL?
- The timeline of events for the U.S – China trade dispute stretches back to June of 2016 and has come a long way as market participants today deal with pricing in both the tangible and intangible impacts of a phase-one trade deal between the two countries. Some key points of discussion include relief on the 15% tariffs that went into effect on September 1st and relief of the 25% tariffs on the core product list that covers products from machinery and semiconductors to furniture. While it remains likely that the technology and intellectual property portion of any deal will not be part of the phase-one agreement, the market seems quite optimistic that the right steps are being taken towards a broader, all-encompassing agreement.
- Despite the fact that China represents a sizable portion of the broader emerging markets basket, the correlation of EM to China currently sits at the highest level since 2015. We believe that this elevated correlation will continue to persist while the market continues to assign a significant weight to trade as a driver for EM returns.
The R-Coefficient for Emerging Markets to China Remains Elevated
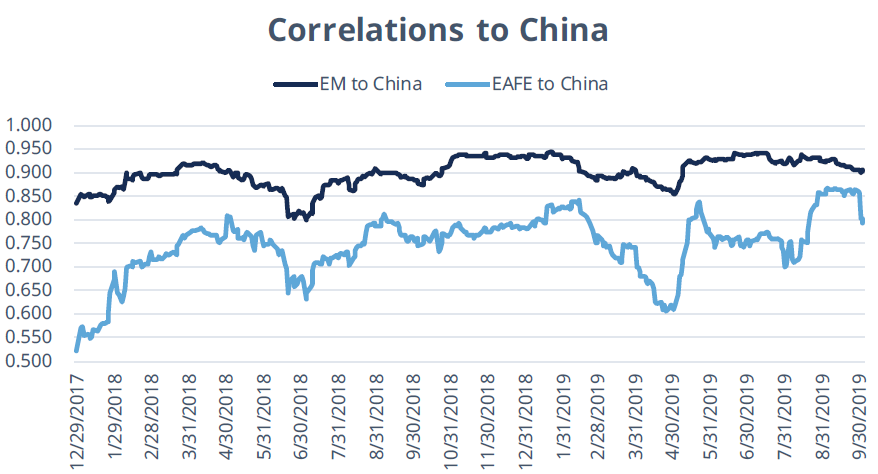
Source: Bloomberg, L.P. as of November 5, 2019. The EM to China line represents the rolling 60-day correlation between the MSCI Emerging Markets IMI Index and the FTSE 50 China Index. The EAFE to China line represents the rolling 60-day correlation between the MSCI EAFE IMI Index and the FTSE 50 China Index.
FLOWS STILL FAVOR DEVELOPED MARKETS
- Weekly net flows into emerging markets are starting to build, and this past week marks the fourth consecutive week of net inflows into emerging markets ETFs, which has not occurred since May. While shorter-term momentum in flows may signal a turning tide for EM, investors are clearly still cautious about the group, as flows into developed markets and the U.S. are far more substantial relative to those seen in emerging markets.
- Over the past six weeks, broad-based emerging markets ETFs have taken in almost $0.70B in net inflows, and while this trails the $1.07B in net inflows for developed markets since late September, it points to signs of optimism for emerging markets, and it represents a stark difference from the outflows seen throughout August.
Emerging Markets ETFs See Buyers, but Investors Favor Opportunities Elsewhere

Source: Bloomberg Finance, L.P., as of September 25, 2019 to November 5, 2019. Data represents the net flows of U.S.-listed Emerging Markets ETFs and Developed Markets ETFs, specifically targeting exposure to the EM and EAFE markets, respectively. For example, when the blue bars are positive, cumulative net flows (week over week) were positive. Where the orange bars are positive, relative net flows were positive. On the other hand, when the blue or orange bars are negative, net flows (absolute or relative) were negative.
CAUTIOUS OPTIMISM FOR EM
Given the history of positive trade developments between the U.S. and China, it is not surprising to see a fairly muted response in terms of market positioning in EM assets. That being said, EM performance, on both an absolute and relative basis, is showing notable signs of positive momentum as the basket approaches year-to-date highs.
For investors trying to assess near-term catalysts and opportunities in EM, especially relative to developed markets, we maintain our view of cautious optimism in this space, understanding the upside potential should a “phase one” deal be signed and steps towards a next phase be communicated.
- All eyes are the steps being taken towards a meeting between President Donald Trump and Xi Jinping, where again, mixed signals persist. While China is said to be reviewing locations in the U.S. where President Xi would be willing to meet with Trump to potentially sign the first phase of a trade deal, headlines also suggest that such an event could be delayed until December. As we’ve seen before, this implies a heavier level of stress on the “cautious” relative to the “optimism.”
- We expect that emerging markets will continue to maintain a certain level of volatility, but emerging market stocks have begun to show signs of improving momentum relative to EAFE stocks, and have now outpaced developed markets by almost 200 basis points over the past six weeks. Continued communication of positive steps towards the phase-one deal could support such price action to continue.
Momentum Improving for EM Relative to EAFE

Source: Bloomberg, L.P., as of November 4, 2016 to November 5, 2019. Data represents the z-scores for the relative momentum between the MSCI Emerging Markets IMI Index and the MSCI EAFE IMI Index on a rolling, 8-week basis.
IMPLEMENTATION IDEAS
- Rooting from the unique 150/50 structure, the Direxion MSCI Emerging Over Developed Markets ETF [RWED] offers investors the opportunity to overweight exposure to Emerging Markets and underweight exposure to Developed Markets and benefit should the current environment lead to Emerging Markets outperformance.
- Conversely, the Direxion MSCI Developed Over Emerging Markets ETF [RWDE] amplifies exposure to Developed Markets at the expense of Emerging Markets allowing investors to benefit relative to long-only strategies if Developed Markets were to outperform.
DEFINITIONS
- MSCI Emerging Markets IMI: The MSCI Emerging Markets Investable Market Index (IMI) captures large, mid and small cap representation across 24 Emerging Markets countries.
- MSCI EAFE IMI: The MSCI EAFE Investable Market Index (IMI), is an equity index which captures large, mid and small cap representation across Developed Markets countries around the world, excluding the US and Canada.
An investor should carefully consider a Fund’s investment objective, risks, charges, and expenses before investing. A Fund’s prospectus and summary prospectus contain this and other information about the Direxion Shares. To obtain a Fund’s prospectus and summary prospectus call 646-291-8907 or click here. A Fund’s prospectus and summary prospectus should be read carefully before investing.
Shares of the Direxion Shares are bought and sold at market price (not NAV) and are not individually redeemed from a Fund. Market Price returns are based upon the midpoint of the bid/ask spread at 4:00 pm EST (when NAV is normally calculated) and do not represent the returns you would receive if you traded shares at other times. Brokerage commissions will reduce returns. Fund returns assume that dividends and capital gains distributions have been reinvested in the Fund at NAV. Some performance results reflect expense reimbursements or recoupments and fee waivers in effect during certain periods shown. Absent these reimbursements or recoupments and fee waivers, results would have been less favorable.
Direxion Relative Weight ETFs Risks – Investing involves risk including possible loss of principal. The Funds’ investments in derivatives may pose risks in addition to, and greater than, those associated with directly investing in or shorting securities or other investments. Investing in, and/or having exposure to, emerging markets instruments involves greater risks than more developed markets due to the potential for greater market volatility, lower trading volume, higher levels of inflation, political and economic instability, greater risk of market shutdown and more government limitations on foreign investments in emerging market countries than typically found in more developed markets. There is no guarantee that the returns on the Funds’ long or short positions will produce high, or even positive returns and a Fund could lose money if either or both of the Fund’s long and short positions produce negative returns. Please see the summary and full prospectuses for a more complete description of these and other risks of the Funds.
Distributor for Direxion Shares: Foreside Fund Services, LLC.
