
- Market Drivers: Stabilizing macro factors and a return to supportive monetary policy have been a large driver of recent 1-month and year-to-date performances for risk assets.
- Performance: Year-to-date performance in U.S. equity markets have been some of the strongest on record. Under the hood, the market has shown some notable performance spreads between pairs such as growth and value stocks, cyclical and defensive sectors, and U.S. and International exposures.
- Flows & Positioning: Flows have mostly followed performance throughout the month. We are starting to see some notable trends in allocations to Growth and Cyclical Sector ETFs.
- What’s Next?: While we are still in the heart of Q1 2019 earnings season, investors should look beyond single stock results to gain confirmation on overall confidence in business segments and the overall U.S. business cycle in light of conflicting macro data.
Market Moves
It has undeniably been quite an extraordinary first four months of the year for broad U.S. markets. The Russell 1000 gained 18.60% (total return) through April, and Small Cap stocks, as measured by the Russell 2000, provided 18.48% through the end of April. To put that into perspective, the last time we saw both Large Caps and Small Caps1 provide greater than 18% total returns over four months’ time was in December of 2010. In terms of seasonality, 2019 provided the strongest January-to-April return for Small Cap stocks since 1991, and the strongest January-to-April return for the Russell 1000 since 1987. As a result, volatility calmed dramatically: the average for the CBOE Volatility Index throughout the first four months of 2019 was 15.56, which was notably lower than the 19.17 average throughout the last four months of 2018.
[1] Large Caps and Small Caps are defined as the Russell 1000 and Russell 2000.
FIGURE 1: Risk Assets have performed remarkably well in 2019
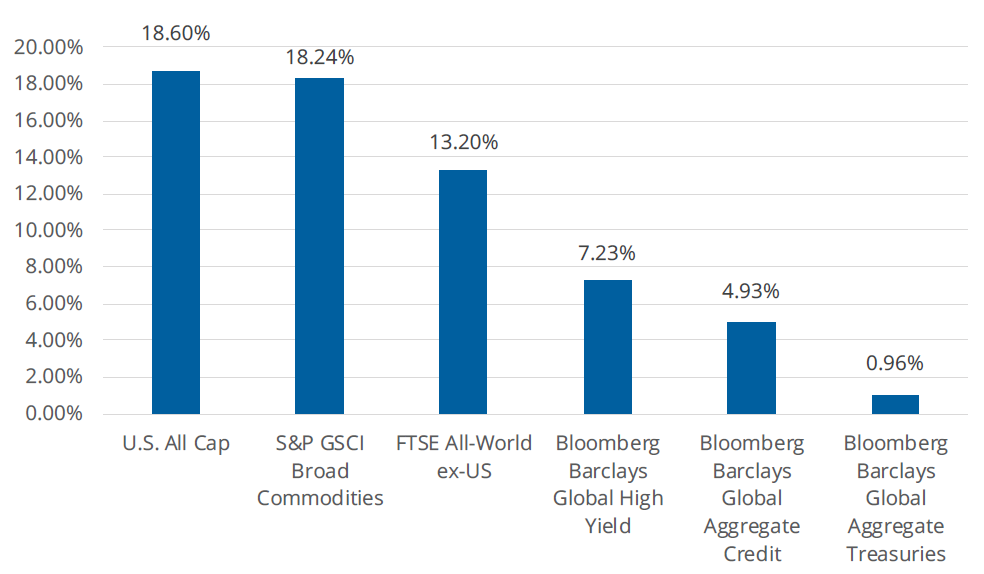
Source: Bloomberg Finance, L.P., as of April 30, 2019. Past performance is not indicative of future results. One cannot invest directly in an index.
So, how did we get here? Has the macro story driving markets changed so much over the last six, nine, or even twelve months that it caused risk assets to soar?
Yes and no. The drawdown throughout Q4 2018, which was marked by an anticipated slowdown in global growth, a rising Federal Funds Rate, and a 10-year yield that sat near 3.20%, resulted in the Russell 1000 and 2000 falling 14% and 20%, respectively. This swift (albeit longer than February 2018) re-pricing in risk assets throughout the fourth quarter set the stage for much of the upside the market has seen thus far in 2019. The anticipation of a slowdown in global growth remains relevant. Major economic PMIs and Industrial measures, such as Durable Goods, Production, Orders, etc. have trended lower, but appear to be stabilizing. Market participants have anticipated lower revenue and earnings growth to follow a macro level slowdown, and while they have largely been correct, Q1 earnings season has not brought the type of volatility that many anticipated, suggesting that the lack of growth has, thus far, been better than expected.
The real inflection point for the markets occurred on January 30, 2019. Following the two-day FOMCmeeting, the Federal Reserve indicated that they will take a more “patient” approach, and that the current (2.25 – 2.50%) level of interest rates were “appropriate for the state of the economy.” The Federal Reserve indicated that it would pause the current rate of rate hikes for the “foreseeable future”, and suspend the unwinding of its balance sheet as well. This was a dramatic, and dovish, change from just one month ago when the Federal Reserve hiked rates in December, and even signaled for three more. While this does not necessarily mean “synchronized global growth” is back, supportive fiscal environments are in place both here in the U.S. and abroad.
The combination of a stabilization of some macro risks, in addition to a resurgence of supportive fiscal policy, resulted in one of the strongest stretches of risk asset performances in quite some time. This is not to say, however, that risks do not remain. Question marks around Brexit and U.S.-China trade are still out there, and potential results look less and less binary as time passes.
Of course, the idea that markets have come too far, too quickly, is a very relevant one, and perhaps one that may lead investors to point towards underlying dynamics within equities, such as the relationship between Cyclical and Defensive Sectors, or Growth and Value stocks.
Relative Value Themes
FIGURE 2: Underlying dynamics within the U.S. & Global Equity Markets
| 1 Month | 3 Month | YTD | |
| U.S. Large Cap | 4.04% | 9.43% | 18.60% |
| U.S. Small Cap | 3.40% | 6.50% | 18.48% |
| Growth | 4.52% | 11.34% | 21.35% |
| Value | 3.55% | 7.54% | 15.90% |
| Cyclical Sectors | 5.98% | 12.21% | 22.58% |
| Defensive Sectors | -0.58% | 3.24% | 9.38% |
| U.S. | 4.04% | 9.43% | 18.60% |
| International | 2.67% | 5.34% | 13.20% |
| Developed Markets | 2.84% | 6.01% | 13.20% |
| Emerging Markets | 0.019 | 0.0312 | 11.75% |
Source: Bloomberg Finance, L.P., as of April 30, 2019. Past performance is not indicative of future returns. One cannot invest directly in an index.
While Large Cap and Small Cap stocks show very similar returns through the close of business on April 30, leadership shifted from Small Caps to Large Caps in a noticeable way. Through the month of January, Small Caps provided almost 3% in outperformance relative to Large Caps. Whether it was driven by a flight to quality, or simply market leadership from Large Cap Technology names, Small Caps gave all of this outperformance back over the trailing three months.
Growth continues to shine relative to Value, and the spread between the two has widened to 5.44% through April. In fact, there has not been a single month throughout 2019 in which Value stocks have outperformed their Growth counterparts. Market participants are starting to see some significant shifts in positioning there as well, as this relative value theme seems to fit the late-cycle story for the market rewarding those companies that show the ability to expand business segments and grow their top-lines amidst rising macro pressure.
Led by the Information Technology, Industrials, Consumer Discretionary, and Communications sectors, Cyclical sectors vastly outperformed Defensive sectors over the trailing 1 month and year-to-date periods. Notably, all four (Staples, Energy, Healthcare, and Utilities) Defensive sectors underperformed the Russell 1000 year-to-date. Having notably outperformed during the Q4 2018 drawdown, Defensives now lag Cyclicals by over 13% as pro-cyclical risk exposures benefitted from an expanding yield curve[2]and stabilizing macro-related data.
In terms of geographical exposures, the U.S. continues to be a leader for equity exposure for both performance and flows. While International exposure (particularly Emerging Markets) looks attractive from a relative valuations perspective, the same flight to quality and macroeconomic factors drove significant investor interest into U.S. equity assets year-to-date. Developed Markets outperformed Emerging Markets over the trailing 1 and 3 months, and investors should continue to watch the U.S. dollar as a proxy for their EM exposures.
[2] As measured by the U.S. Treasury 2-Year by 10-Year spread.
RELATIVE WEIGHT WINNERS & LOSERS
FIGURE 3: Widening Spreads have resulted in notable Relative Weight Winners & Losers
| 1 Month | 3 Month | YTD | |
| U.S. Large over Small | 4.33% | 10.78% | 18.44% |
| U.S. Small over Large | 3.05% | 4.91% | 18.18% |
| Growth over Value | 4.98% | 13.18% | 24.01% |
| Value over Growth | 3.03% | 5.58% | 13.13% |
| Cyclical over Defensive Sectors | 9.23% | 16.70% | 29.39% |
| Defensive over Cyclical Sectors | -3.89% | -1.22% | 3.00% |
| U.S. over International | 4.71% | 11.46% | 21.28% |
| International over U.S. | 1.88% | 3.08% | 10.24% |
| EAFE over Emerging Markets | 3.28% | 7.36% | 13.74% |
| Emerging Markets over EAFE | 1.39% | 1.58% | 10.87% |
Source: Bloomberg Finance, L.P., as of April 30, 2019.Past performance is not indicative of future returns. One cannot invest directly in an index.
MONEY IN MOTION
Unlike traditional ETF flow commentary that includes the entire set of ETFs in a given category regardless of how they are constructed, we focus on ETFs that specifically offer exposure to the intended underlying categories in order to more precisely identify trends. For example, our U.S. Large Cap category only focuses on ETFs that seek to track broad-based U.S. Large Cap equities and excludes ETFs that may be exposed to U.S. Large Caps, but have other intended investment objectives, such as a style or factor tilt.
ETF flows were very much in-line with performance over the last month. Throughout eight U.S. Large Cap ETFs (with over $700B in combined assets under management), we saw $12.6B in net inflows over the month of April. This marks the third straight month of net positive flows for these products within the U.S. Large Cap Category. Alternatively, U.S. Small Caps (as measured by ten Small Cap ETFs with over $130B in combined assets under management) saw the third straight month of outflows, with $0.84B in redemptions over the month of April. The $13.4B relative spread in flows between U.S. Large Caps and Small Caps was the largest since January.
While smaller in scale, Growth ETFs saw the fourth straight month (and largest year-to-date) in positive relative flows vs. Value ETFs, bringing in $1.43B in net creation activity across thirteen products. This suggests that market participants expanded their allocations to Growth, bucking the longer-term (2-year and 3-year) trend towards Value exposure.
Led by the Financials, Consumer Discretionary, Information Technology, and Communication Services sectors, Cyclical Sectors (28 ETFs) saw $3.04B in net inflows throughout April, outpacing Defensive sectors (16 ETFs) by $4.61B. With the introduction of “Medicare for All”, investors spent April de-risking Healthcare exposures, and it was by far the largest laggard across Defensive Sectors when it came to flows.
With U.S. and international exposures, U.S. focused ETFs finished the month of April with $12.57B more in flows than in internationally focused ETFs. This marked the third straight month of relative strength in flows, and the U.S. has outpaced International ETFs by almost $30B in flows since February. Unsurprisingly, flows were light within Emerging Markets ETFs and Developed Markets ETFs. Due to the strength in the U.S. dollar, Emerging Markets ETFs saw only $1.14B in net creation activity over the past two months, and slightly trail Developed Markets ETFs in relative flows.
FIGURE 4: Relative Strength in Flows by Month
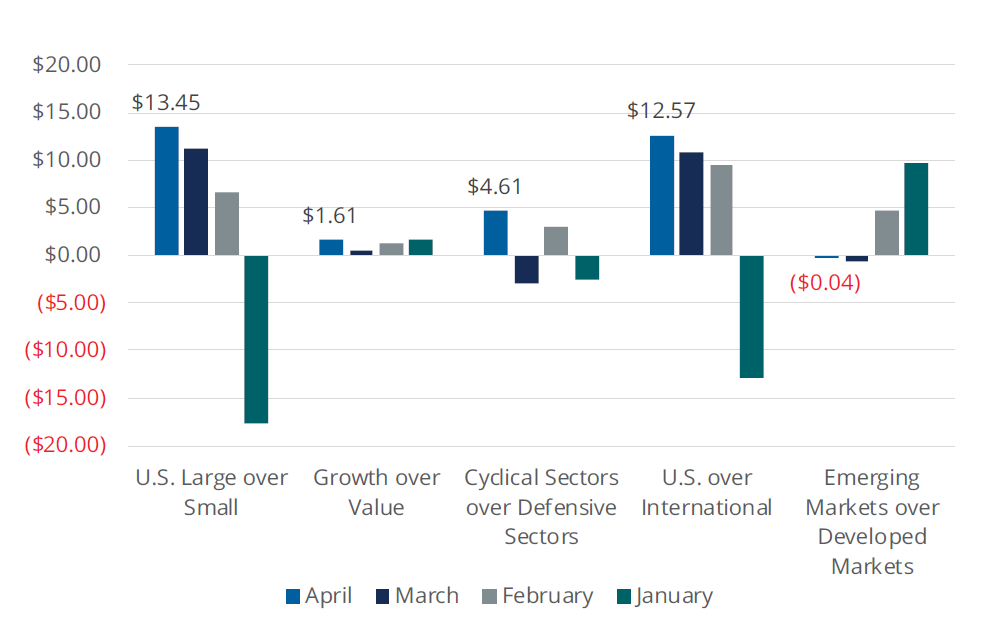
Source: Bloomberg Finance, L.P., as of April 30, 2019.
WHERE ARE WE GOING?
With roughly 40% of the Russell 1000 yet to report Q1 2019 earnings results, investors should continue to watch earnings, with a focus on the macro: confidence in business segments and overall demand, the overall business cycle, and forward guidance. Thus far, only 51% of Russell 1000 companies have reported beats vs. expectations on top-line results, but over 67% of Russell 1000 companies have reported beats vs. expectations on bottom-lines; significant late-cycle margin compression may be less of a short-term concern than many may have expected entering 2019.
With the U.S. and China set to begin a fresh round of trade talks in Beijing, investors should pay attention to headlines surrounding existing tariffs (10% reference and the 25% reference) and potential tariff resolutions. While sentiment seems to be one of “cautious optimism”, investors should again focus on the macro instead of using single headlines to drive asset allocation decisions.
Cautious optimism seems to be the state of the markets today, as we saw the Russell 1000 close at all-time highs multiple times throughout April. Given how much risk assets have returned year-to-date, it may be hard to counter said cautiousness. Looking under the hood, however, some interesting dynamics have developed that investors should be paying attention to. The notable relative performances between Cyclical and Defensive sectors, Growth and Value stocks, and U.S. and International exposures provided opportunities for investors tilting their allocations one way or another.
FIGURE 5: Recovery Seen in Month-over-Month Leading Index
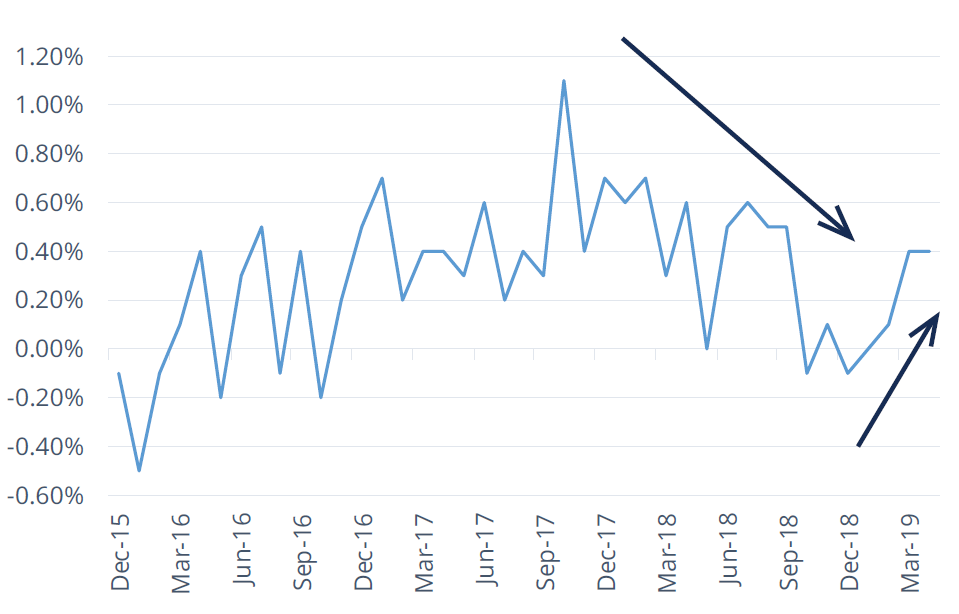
Source: Bloomberg Finance, L.P., as of April 30, 2019. Data displayed is the Conference Board U.S. Leading Index Month-over-Month.
Definitions
| Market | Representative Index |
| U.S. Large Cap | Russell 1000 Index |
| U.S. Small Cap | Russell 2000 Index |
| U.S. Growth | Russell 1000 Growth Index |
| U.S. Value | Russell 1000 Value Index |
| U.S. Cyclical Sectors | MSCI USA Cyclical Sectors Index |
| U.S. Defensive Sectors | MSCI USA Defensive Sectors Index |
| U.S. | Russell 1000 Index |
| International | FTSE All-World ex US Index |
| Developed Markets | MSCI EAFE IMI |
| Emerging Markets | MSCI Emerging Markets IMI |
- Russell 1000: The Russell 1000 Index consists of the largest 1,000 companies in the Russell 3000 Index, which is made up of 3,000 of the largest U.S. companies.
- Russell 2000: The Russell 2000 Index is comprised of the smallest 2000 companies in the Russell 3000 Index, representing approximately 8% of the Russell 3000 total market capitalization.
- Russell 1000 Growth: The Russell 1000 Growth Index measures the performance of those Russell 1000 companies with higher price-to-book ratios and higher forecasted growth values.
- Russell 1000 Value: The Russell 1000 Value Index measures the performance of those Russell 1000 companies with lower price-to-book ratios and lower forecasted growth values.
- MSCI USA Cyclical Sectors: The MSCI USA Cyclical Sectors Index is based on MSCI USA Index, its parent index and captures large and mid-cap segments of the US market. The index is designed to reflect the performance of the opportunity set of global cyclical companies across various GICS® sectors. All constituent securities from Consumer Discretionary, Financials, Industrials, Information Technology and Materials are included in the Index.
- MSCI USA Defensive Sectors: The MSCI USA Defensive Sectors Index is based on MSCI USA Index, its parent index and captures large and mid-cap segments of the US market. The index is designed to reflect the performance of the opportunity set of global defensive companies across various GICS® sectors. All constituent securities from Consumer Staples, Energy, Healthcare, Telecommunication Services and Utilities are included in the Index.
- FTSE All-World ex US: The FTSE All-World Excluding United States Index is a free float market capitalization weighted index. FTSE All-World Indices include constituents of the Large and Mid-capitalization universe for Developed and Emerging Market segments.
- MSCI EAFE IMI: The MSCI EAFE Investable Market Index (IMI), is an equity index which captures large, mid and small cap representation across Developed Markets countries around the world, excluding the US and Canada.
- MSCI Emerging Markets IMI: The MSCI Emerging Markets Investable Market Index (IMI) captures large, mid and small cap representation across 24 Emerging Markets (EM) countries.
Direxion Relative Weight ETF Risks: Investing involves risk including possible loss of principal. The ETFs’ investments in derivatives may pose risks in addition to, and greater than, those associated with directly investing in or shorting securities or other investments. There is no guarantee that the returns on an ETF’s long or short positions will produce high, or even positive returns and the ETF could lose money if either or both of the ETF’s long and short positions produce negative returns. Please see the summary and full prospectuses for a more complete description of these and other risks of the ETFs.
An investor should carefully consider a Fund’s investment objective, risks, charges, and expenses before investing. A Fund’s prospectus and summary prospectus contain this and other information about the Direxion Shares. To obtain a Fund’s prospectus and summary prospectus call 866-476-7523 or visit our website at direxioninvestments.com. A Fund’s prospectus and summary prospectus should be read carefully before investing.
Distributor: Foreside Fund Services, LLC
