
Overview: Muddier Waters To Wade
- Market Drivers: Mixed results from major economic data releases and corporate earnings releases have resulted in cautious optimism from investors, but forward guidance from the Federal Reserve and developments in U.S. – China trade relations have muddied the investing landscape again.
- Performance: Recent Winners largely extended their leadership in July, as large caps outpaced small Caps, growth stocks outperformed their value counterparts, and cyclical sectors led defensives. International markets turned in a month of negative performance, which was only the second such occurrence of the year as emerging markets (- 1.25%) lagged international developed (- 1.19%).
- Flows & Positioning: For the first time since January, both Growth and Value ETFs saw net redemption activity throughout the month, with value outpacing growth flows on a relative basis. Large cap ETFs continue to outpace small cap products, and while international ETFs continue to see net inflows despite performance, they pale in comparison to U.S. equity flows.
- What’s Next?: The drawdown that occurred at the end of July is not only tied to “weaker-than-expected” guidance from the Federal Reserve, but the re-emergence of trade tensions between the U.S. and China. Macroeconomic risks related to trade will drive market sentiment for the near-term, and we see heightened risks of unintended consequences to derail our preferred positioning.
MARKET MOVES – MIXED SIGNALS
Mixed signals across various economic data releases and market segment performances are complicating the investment landscape. At the macro level, hard economic data from government agencies, such as month-over-month GDP (2.1% vs. 1.8%) or durable goods orders (2.0% vs. 0.7% for June), has shown signs of strength, while soft data such as University of Michigan Consumer Sentiment (98.4 vs. 98.8) or ISM Prices Paid (47.9 vs. 53.0) are pointing to signs of weakness. An overall theme that continues to stand out is the overall strength in consumer-centric and service-oriented data, especially relative to softening manufacturing related data.
Throughout the month of July, risky assets generally did well as bond yields continued to fall. Companies with higher-than-average levels of growth performed notably better than those with cheaper valuations, and large caps outperformed small cap names for the fourth time in seven months, and now lead by 3.03% on the year. The rest of the world has yet to enjoy the returns that are being seen in the U.S., as emerging markets and the developed international markets have lagged the U.S. for yet another month.
EARNINGS EXCEEDING EXPECTATIONS
Overall, earnings season throughout Q2 continues to exceed analyst expectations for negative growth, which has been a fairly positive sign for corporate health. With close to 70% of the Russell 1000 having reported results thus far, both sales and earnings results have largely surprised to the upside. That is to say that aggregate top-line results for U.S. large cap companies have come in better-than-expected so far, by roughly 0.70%, and bottom-line results have looked even better than expected, with aggregate results beating expectations by 5.00%.
The same can be said for U.S. small cap companies, with just over 50% of the Russell 2000 having reported aggregate sales and earnings beats of 0.68% and 16.71%, respectively. Notably, the upside surprises versus expectations have been more broad based for large caps, especially for bottom lines. For small caps, the upside surprise in earnings have mostly been driven by the Consumer Discretionary, Communication Services, Information Technology, and Materials Sectors. In the small cap space, the Health Care and Utilities Sectors have reported downside surprises vs. expectations, while only the Energy Sector has done so within large caps.
Companies tied to the U.S. consumer, on average, have had better results than those more tied to the global economy. We have also seen companies beating expectations, especially when it comes to forward guidance, being rewarded more than they have historically, while those missing expectations or providing uninspiring guidance have been punished.
MONETARY POLICY ON OUR MINDS…
Even with company specific news making headlines, stocks were heavily influenced by the potential for accommodative monetary policy announcements from the European Central Bank and the U.S. Federal Reserve. Indeed, both delivered on these hopes with the ECB making it clear that they would be open to rate cuts and additional asset purchases.
For their part, the U.S. Federal Reserve cut administered rates by the 25 bps the market expected, noting uncertainty to the growth outlook and persistently low inflation expectations. However, the cut came with hawkish dissents indicating divergent views of voting members. The July 31 meeting was in some ways “disappointing,” as the Fed merely delivered on their telegraphed insurance cut, as opposed to guiding the markets towards a renewed round of outright accommodation. That being said, however, Chairman Powell made it clear in his press conference that this was not a one-and-done event with investors increasingly seeing 1995 and 1998 as prologues to today. Two of the largest surprises were the U.S. Dollar’s strength and the flattening of the 2-10 Year yield curve.
FIGURE 1: THE GAP BETWEEN SERVICES AND MANUFACTURING PMIS PREVAILS
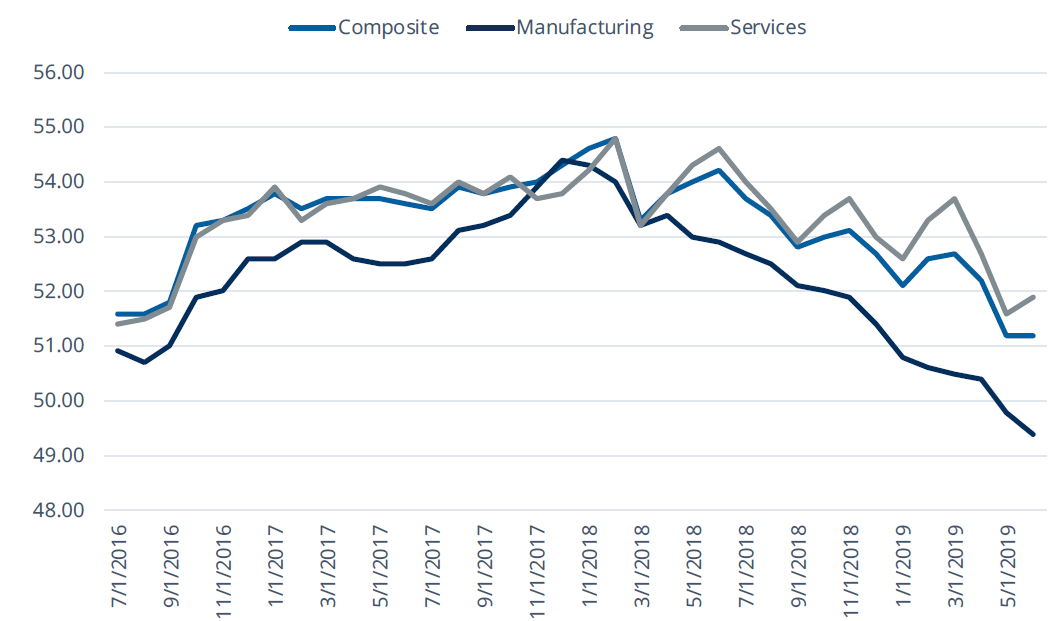
Source: Bloomberg Finance, L.P., as of July 31, 2019. Data reflects the monthly readings of the Markit Global Composite PMI, Markit Global Manufacturing PMI, and Markit Global Services PMI. Past performance is not indicative of future results. One cannot invest directly in an index.
RELATIVE VALUE THEMES
LARGE CAPS LEAD & DOMESTIC EXPOSURES DOMINATE
Large Caps [1] (+ 1.55%) outpaced Small Caps [2] (+ 0.58%) for the fourth time this year, and it was the fourth time in the last five months for large cap leadership. Year-to-date, the spread widened to 3.03%, and the year-over-year spread has now widened to 12.42%. The outperformance seen in large caps over the last month was largely driven by the Information Technology, Communication Services, and Financials Sectors, all of which outpaced the broader market by more than 1.00%. As the macro environment becomes increasingly more opaque, we believe that large caps have offered investors exposure to higher quality names and companies that are better suited to operate in an environment where longer-term yields continue to fall.
While large caps continue to show strength relative to small caps, both have done exceptionally well relative to international exposures. The U.S. has outpaced International exposures by 8.27% throughout calendar year 2019 thus far, and outperformed by 2.69% in the month of July. From a pure performance perspective, domestic equities have dominated international stocks and have only seen three months of relative underperformance over the last twelve. While our model indicates that percentiles for valuations (such as Price-to-Book and both current and Forward Price-to-Earnings) for the U.S. relative to international exposures are on the rise, the overhang of trade tensions and geopolitical risks keep us grounded in maintaining a significant lean towards U.S. equity exposures.
[1] Large Caps: As defined by the Russell 1000 Total Return Index.
[2] Small Caps: As defined by the Russell 2000 Total Return index.
FIGURE 2: LARGE CAPS CONTINUE TO OUTPERFORM IN THIS RATE ENVIRONMENT
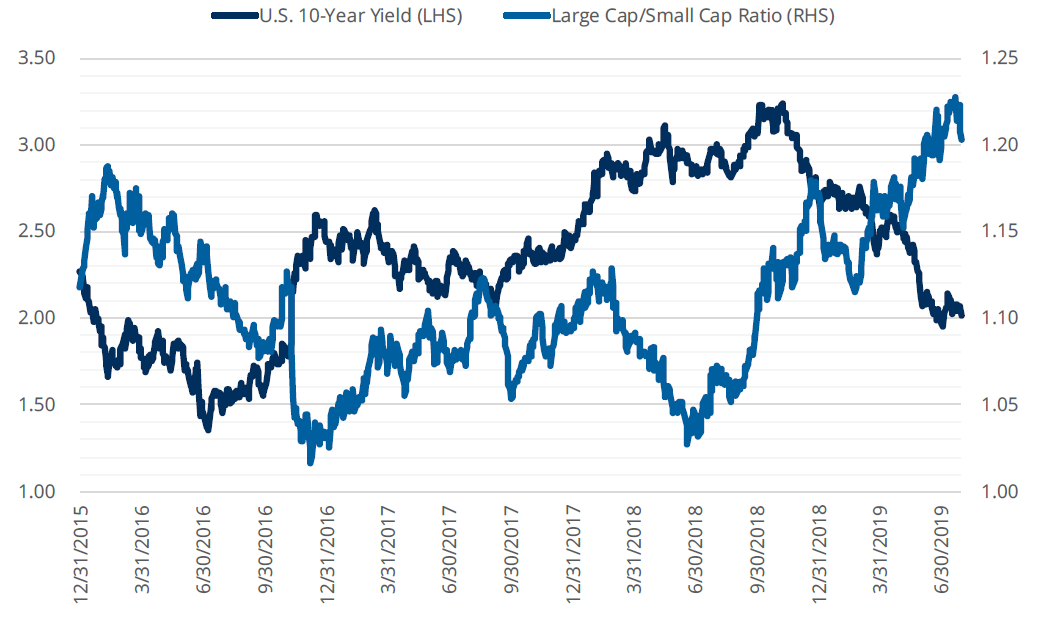
Source: Bloomberg Finance, L.P., as of July 31, 2019. The blue line represents the ratio between the Russell 1000 Large Cap and Russell 2000 Small Cap Indexes. One cannot directly invest in an index.
LONG GROWTH, CYCLICALS ENDURE
Growth names outperformed their value counterparts to the tune of 1.43% over the course of July, and have outperformed in 9 out of the trailing 12 months. We continue to argue that the macroeconomic and business cycle environments support the case for this to continue, especially over the near-term. Whether an investor is looking at PMIs and other sentiment surveys, or the U.S. 10-Year Yield as an indicator of forward guidance on growth, the idea that growth is becoming scarcer is quite prevalent. In fact, one could argue that both “growth-centric” and “cyclical” names have even diverged from macro-level growth indicators. That being said, the market seems to continue to reward companies that are exhibiting higher-than-average levels of growth, and the flat yield curve continues to supports the idea for growth leadership relative to value. From an earnings perspective, growth names, on aggregate, have outpaced value stocks for both top-line and bottom-line results vs. expectations thus far.
Led by the Information Technology, Communication Services, and Financials Sectors, cyclicals outpaced defensives by 2.87% during July, and now leads on both a year-over-year and year-to-date basis by 5.81% and 13.89%, respectively. While Consumer Staples names had a strong month, Utilities, Healthcare, and Energy Sector stocks continue to lag the broader market, and this has resulted in the largest single month spread between these two segments since April.
BEST OF THE WORST FOR EM & EAFE
Out of the 10 market segments and asset classes that we track, emerging markets and developed international markets were the two worst performing throughout the month of July. There is no clear leadership here over longer time horizons, as emerging markets have lagged on a year-to-date basis (- 3.70%), but lead on a year-over-year basis (+ 0.54%). Over the trailing 2-years, emerging markets have lagged their developed counterparts by 1.90%, but are slight leaders (+ 3.36%) over the trailing 3-years. For investors looking to maintain allocations here, our model indicates that valuations are too close to make a definitive call for EM relative to EAFE, but shorter-term relative performance and momentum leans towards EAFE relative to EM. With currency markets back on the forefront, we urge investors to continue to have a stance on the U.S. dollar when making decisions for EM or EAFE allocations.
FIGURE 3: GROWTH & CYCLICAL EXPOSURES CONTINUE TO OUTPERFORM

Source: Bloomberg Finance, L.P., as of July 31, 2019. The data displays the ratio between a pair of indexes. Growth represented by the Russell 1000 Growth Index. Value represented by the Russell 1000 Value Index. Cyclicals represented by the MSCI USA Cyclical Sectors Index. Defensives represented by the MSCI USA Defensive Sectors Index. One cannot invest directly in an index.
MONEY IN MOTION
Unlike traditional ETF flow commentary that includes the entire set of ETFs in a given category regardless of how they are constructed, we focus on ETFs that specifically offer exposure to the intended underlying categories in order to more precisely identify trends. For example, our U.S. large cap category focuses only on ETFs that seek to track broad-based U.S. large cap equities and excludes ETFs that may be exposed to U.S. large caps, but have other intended investment goals, such as a style or factor tilt.
AGGREGATE FLOWS STRONG IN JULY
Overall, July was a strong month for equity flows in general, as we saw net creation activity to the tune of $23.750B across the ten equity segments, slightly larger than what we saw in June. For perspective, the 3-month net flows ended July amounted to $10.01B (largely driven by May, where we saw over $35.42B in net redemptions), and the aggregate 6-month net flows ended July was $79.40B. Unlike June, however, the flows were dominated by a few categories, and we saw net redemption activity across four market segments relative to just one in June.
U.S. large caps and U.S. total market ETFs brought in $9.77B and $11.24B in net inflows, respectively, and they were the two largest categories with net inflows on the month. These two categories also represented the two largest relative strength leaders in terms of flows, as U.S. large cap flows outpaced U.S. small cap flows by $7.61B, and U.S. equity flows outpaced international equity flows by $9.39B. The theme here has been intact over every time horizon we look at, where there are relative leaders in both shorter-term relative strength (e.g. 1-month, 3-month, and 6-month) and longer-term positioning (e.g. 1-year, 2-year, and 3-year flows).
GROWTH & VALUE SEES OUTFLOWS
While a relatively small figure for both equity styles, both growth and value ETFs saw net redemptions during the month of July, which marks the first such occasion since January. Growth ETFs (13 products in total) combined for $0.735B in net redemptions, and value ETFs (13 products) combined for $0.581B in net outflows. As a result, value names outpaced growth ETFs from a monthly relative strength perspective, which marked the first time since December 2018. While we’re closely watching how investors may or may not be rotating allocations as they continue to digest developments around trade, we view this as more of a one-off. Our ETF flows model, which looks at trailing 1-Month, 3-Month, and 6-month flows to more holistically gauge relative strength in flows, still points to moderate strength in growth flows relative to value.
INVESTORS SEEKING CYCLICAL EXPOSURES
It was almost a bogey-free month for cyclical sectors in July, as six of seven GICS sectors saw net inflows, and the group as a whole took in $2.170B for the month. Cyclical sectors took in $3.045B more than defensive Sectors, as three out of four defensive sectors saw net redemptions in July. Led by positive flows into the Information Technology Sector (+ $0.686B), the Real Estate (+ $0.637B), Consumer Discretionary (+ $0.491B), Basic Materials (+ $0.291), Financials (+ $0.280), and Communication Services (+ $0.036B) Sectors all saw positive net activity, with the only net outflows coming from Industrials, where $0.253B was redeemed throughout July. For the defensive sectors, Healthcare was the stark laggard with $0.891B in net outflows. Energy (- $0.213B) and Utilities (- $0.055B) were also weak, and Consumer Staples was the only defensive sector with positive activity, bringing in $0.286B.
We believe that investors will more than likely be pickier with their sector allocations, but from both a performance and flows perspective, cyclical sectors have a commanding lead over defensives.
INTERNATIONAL EQUITY FLOWS MIXED & WEAK
Flows into the rest of the world were largely weak, with developed markets seeing slight inflows to the tune of $0.420B, and emerging markets seeing outflows to the tune of $1.676B. While broad international flows leaned positive (+ $1.858B), they were once again the largest relative laggard for the month compared to broad U.S. equity flows (+ $11.243B). Interestingly, our model shows the largest scores for relative strength in flows and longer-term market positioning for these two categories: U.S. over international strength in flows is the highest scoring, while developed markets over emerging markets ranks second.
FIGURE 4: TRAILING 1, 3, AND 6-MONTH RELATIVE STRENGTH IN FLOWS

Source: Bloomberg Finance, L.P., as of July 31, 2019. Data represented by the following indexes: the Russell 1000 Total Return Index, the FTSE All World ex-US RIC Index, the Russell 2000 Small Cap Index, the MSCI USA Cyclical Sectors Index, the MSCI USA Defensive Sectors Index, the MSCI Emerging Markets IMI USD Index, and the MSCI EAFE IMI USD Index. Past performance is not indicative of future results. One cannot invest directly in an index.
WHERE ARE WE GOING?
Investors should remember that uncertainty always exists. Only this time, it’s mostly related to trade policy, which is difficult to model because of its wide ranging impacts to corporate decision making. Overall, we remain favorable on companies with high margins that are growing earnings because they are more insulated from any of the negatives that could come to fruition.
One of the biggest risks we see to our current views and the overall equity market is that consensus today seems overly consensus. In other words, our views align with the majority of our peers and are broadly consistent with what we hear from clients as well. At its best, it is simply a function of investors sticking with what has been working. At its worst, it is a sign of complacency and potential overcrowding that may magnify any drawdowns.
Indeed, historically August and September tend to be the weakest months of equity performance. Indeed, the investing landscape has become more opaque with this administration openly labeling China as a currency manipulator and trade tensions on the rise. With that said, investors would be best suited to stay true to their asset allocations, take the recent market activity with a grain of salt, and continue to watch how trade policy develops to determine next steps.
FIGURE 5: UNCERTAINTY IN GLOBAL ECONOMIC POLICY IS ON THE RISE
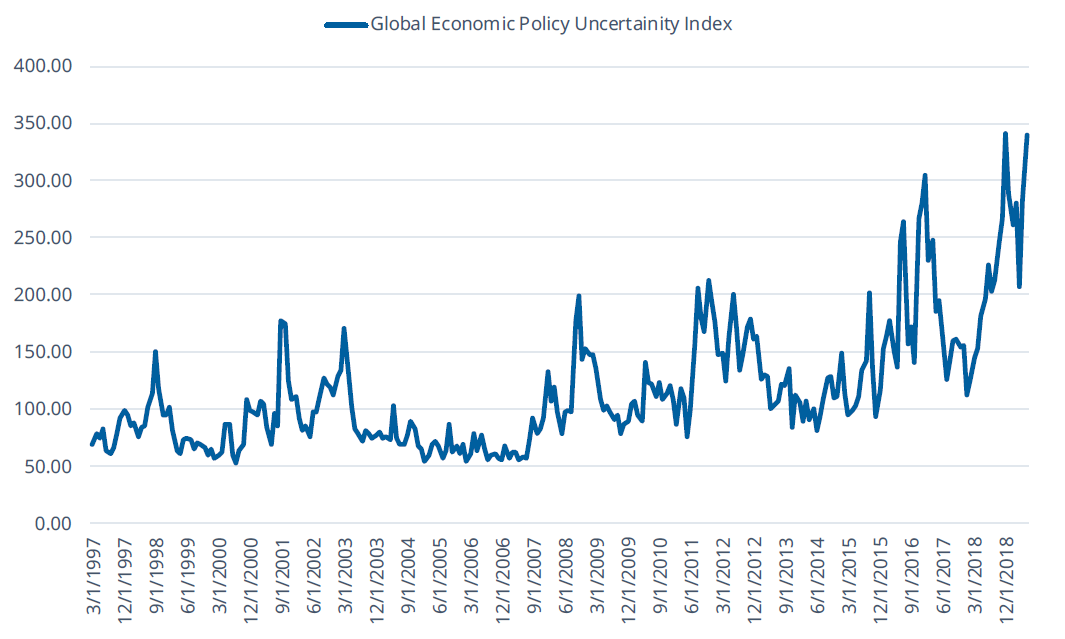
Source: Bloomberg Finance, L.P., as of July 31, 2019. Past performance is not indicative of future results. One cannot invest directly in an index.
DEFINITIONS
• Russell 1000: The Russell 1000 Index consists of the largest 1,000 companies in the Russell 3000 Index, which is made up of 3,000 of the largest U.S. companies.
• Russell 2000: The Russell 2000 Index is comprised of the smallest 2000 companies in the Russell 3000 Index, representing approximately 8% of the Russell 3000 total market capitalization.
• Russell 1000 Growth: The Russell 1000 Growth Index measures the performance of those Russell 1000 companies with higher price-to-book ratios and higher forecasted growth values.
• Russell 1000 Value: The Russell 1000 Value Index measures the performance of those Russell 1000 companies with lower price-to-book ratios and lower forecasted growth values.
• MSCI USA Cyclical Sectors: The MSCI USA Cyclical Sectors Index is based on MSCI USA Index, its parent index and captures large and mid-cap segments of the US market. The index is designed to reflect the performance of the opportunity set of global cyclical companies across various GICS® sectors. All constituent securities from Consumer Discretionary, Financials, Industrials, Information Technology and Materials are included in the Index.
• MSCI USA Defensive Sectors: The MSCI USA Defensive Sectors Index is based on MSCI USA Index, its parent index and captures large and mid-cap segments of the US market. The index is designed to reflect the performance of the opportunity set of global defensive companies across various GICS® sectors. All constituent securities from Consumer Staples, Energy, Healthcare, Telecommunication Services and Utilities are included in the Index.
• FTSE All-World ex US: The FTSE All-World Excluding United States Index is a free float market capitalization weighted index. FTSE All-World Indices include constituents of the Large and Mid-capitalization universe for Developed and Emerging Market segments.
• MSCI EAFE IMI: The MSCI EAFE Investable Market Index (IMI), is an equity index which captures large, mid and small cap representation across Developed Markets countries around the world, excluding the US and Canada.
• MSCI Emerging Markets IMI: The MSCI Emerging Markets Investable Market Index (IMI) captures large, mid and small cap representation across 24 Emerging Markets (EM) countries.
An investor should carefully consider a Fund’s investment objective, risks, charges, and expenses before investing. A Fund’s prospectus and summary prospectus contain this and other information about the Direxion Shares. To obtain a Fund’s prospectus and summary prospectus call 866-476-7523 or visit our website at direxioninvestments.com. A Fund’s prospectus and summary prospectus should be read carefully before investing.
Shares of the Direxion Shares are bought and sold at market price (not NAV) and are not individually redeemed from a Fund. Market Price returns are based upon the midpoint of the bid/ask spread at 4:00 pm EST (when NAV is normally calculated) and do not represent the returns you would receive if you traded shares at other times. Brokerage commissions will reduce returns. Fund returns assume that dividends and capital gains distributions have been reinvested in the Fund at NAV. Some performance results reflect expense reimbursements or recoupments and fee waivers in effect during certain periods shown. Absent these reimbursements or recoupments and fee waivers, results would have been less favorable.
Direxion Relative Weight ETFs Risks – Investing involves risk including possible loss of principal. The ETFs’ investments in derivatives may pose risks in addition to, and greater than, those associated with directly investing in or shorting securities or other investments. There is no guarantee that the returns on an ETF’s long or short positions will produce high, or even positive returns and the ETF could lose money if either or both of the ETF’s long and short positions produce negative returns. Please see the summary and full prospectuses for a more complete description of these and other risks of the ETFs.
Distributor for Direxion Shares: Foreside Fund Services, LLC.
