
By Direxion
Up, Up and Away!
OVERVIEW
- Investors drove U.S. markets to new all-time highs thanks to progress on the U.S.-China trade deal, accommodative monetary policy and better than expected earnings.
- ETF investors made some risk-on moves last month as they allocated to non-U.S. equities.
- While we acknowledge that out-of-favor areas, such as small caps and value stocks, may see a relief rally, we continue to favor growth and large caps unless we see a material boost to economic data.
Markets Move Up and Away
Economic data continues to point toward bifurcation that sees the U.S. consumer chugging along, but manufacturing around the globe remaining sluggish. However, anyone looking for markets to react negatively to the continued weak global manufacturing data was left hurting in October as markets ripped to new all-time new highs. Investors caught bullish feelings thanks to progress on the U.S.-China trade deal, the avoidance of a hard Brexit, continued accommodating monetary policy, and another decent earnings season. In our opinion, investors may be showing some signs of complacency of a reflation trade considering that earnings are far from inspiring as beats are below average. Recent price action simply may highlight how investors seem to have priced in much of the bad economic news and believe that central banks have their back should the picture deteriorate markedly from here.
FIGURE 1: THE S&P 500 IS NOW WELL ABOVE ITS 50-DAY MOVING AVERAGE
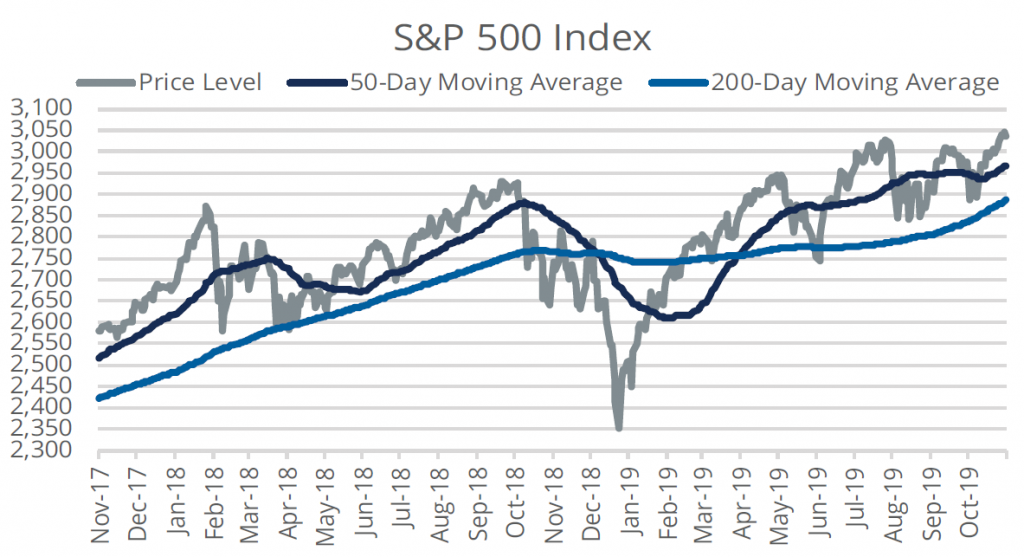
Bloomberg Finance, L.P., as of October 31, 2019. Past performance is not indicative of future results. One cannot invest directly in an index.
Emerging Markets Lead the Way
Performance in October was broad-based as all regions around the globe had positive returns. Emerging markets led the way, followed by international developed markets making the U.S. a relative laggard. Over the last year, U.S. markets remain in the lead by 2.28% as investors have favored the growth potential of U.S. markets compared to the more value-orientated developed. Emerging market stocks have seen their trend being set by the ebbs and flows of the U.S.-China trade war.
In the U.S., September’s rotation to value stocks proved to be short lived as growth outperformed by 1.42% last month. Cyclical sectors bested defensive sectors by 0.44% thanks to the continued risk-on tone. However, small caps beat large caps for the second straight month. Over the last twelve months, cyclical sectors and value stocks are neck and neck in the performance, leading with each up over 17%. On the other hand, small caps are the laggards being up only 4.90%, which is 9.25% below that of large caps as small cap earnings have been challenged.
FIGURE 2: EMERGING MARKETS OUTPERFORMED IN OCTOBER
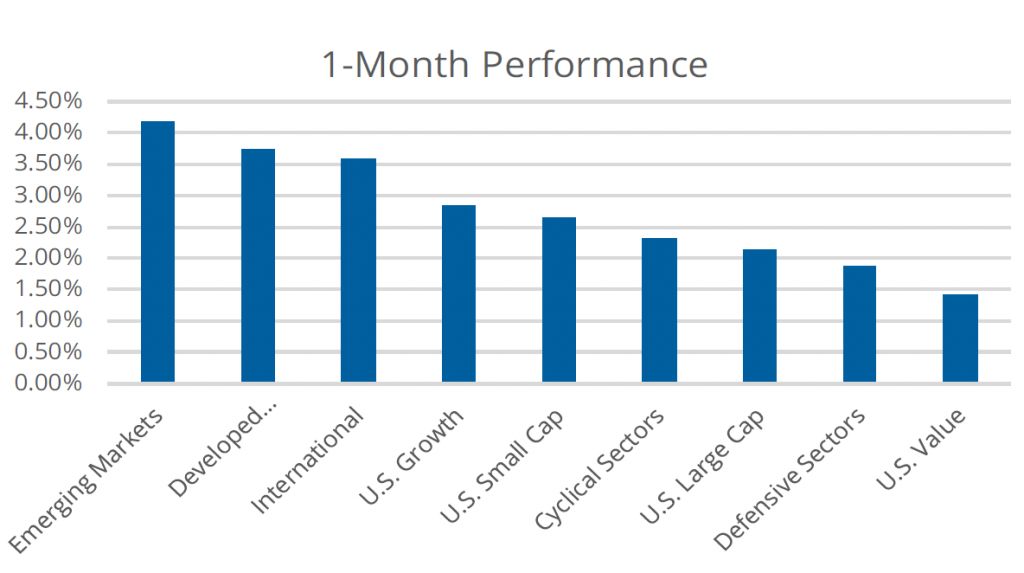

Bloomberg Finance, L.P., as of October 31, 2019. Past performance is not indicative of future results. One cannot invest directly in an index. The data is representative of the 1-month returns of the indexes found in the Definitions list below.
ETF Investors Show Some Love for International Exposure
Notably, ETF investors continue to play defense in the aggregate as fixed income ETFs continue to take in the lion’s share of flows compared to equity ETFs. However, they are showing some signs of positioning for a reversal. For example, after outperforming for two months, investors added more capital to international developed markets compared to U.S. exposures. Specifically, internationally-focused ETFs took in $2.16 billion last month, while investors redeemed $5.13 billion from U.S. ETFs. While growth reasserted its dominance over value last month from a performance perspective, value ETFs took in $2.42 billion more than growth ETFs last month alone, bringing the difference over the last three months to $5.38 billion. Another potential sign of reversal toward reflationary assets is that cyclical sector ETFs had $1.08 billion greater inflows than defensive sectors, which contrasts with the $10.78 billion in favor of defensives over the last twelve months.
FIGURE 3: ETF INVESTORS MAY BE POSITIONING FOR A ROTATION
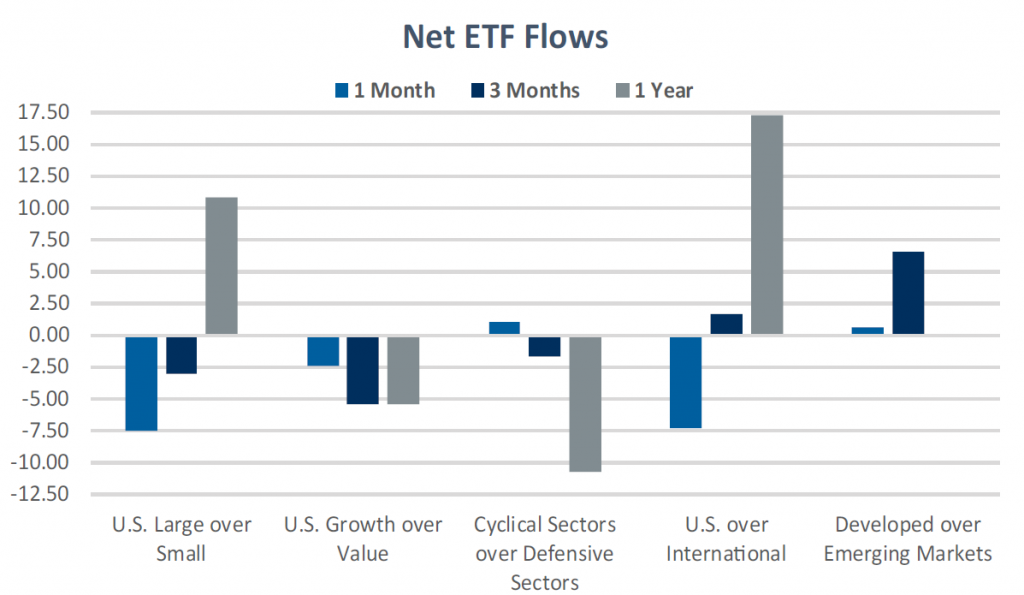

Bloomberg Finance, L.P., as of October 31, 2019. Data displays the difference in net flows of ETFs tracking the five pairs of equity segments relative to one another. Each equity segment is comprised of a group of ETFs that track indexes that are representative of those broad exposures, covering both the broad domestic and broad international equity market segments.
Trade Wars, Tweets and the Next Election Cycle.
In the near-term, constructive developments on the trade front will likely continue to support the market’s momentum, unless we see a material downturn in data that spills over to the consumer. Of course, the potential for re-escalation of the trade war is only a Tweet away. However, that may be subdued by the impeachment inquiry and the 2020 US Presidential election. On the policy front, the Federal Reserve has indicated that they are back to being data dependent and the market seems to be satisfied that they have done enough to steepen the yield curve as part of its mid-cycle adjustment. This has helped to put a lid on the U.S. dollar and boost areas like international developed and emerging market equities that had a cloud of uncertainty around them as we are now entering a bull market across the board. While in the short-term, value and small caps to get a boost from the removal of many trade-related question marks that could have derailed the economic expansion, we do not think we are setting up for a sustained rebound of those groups.
Current Positioning
Figure 4 highlights the current positioning of our quantitatively-based Relative Weight Model. These views are recalibrated monthly based on composite measures of momentum and valuation.
FIGURE 4: RELATIVE WEIGHT POSITIONING
| Momentum Composite | Valuation Composite | Overall | |
| U.S. Large Cap / Small Cap | Large Cap | Small Cap | Large Cap |
| U.S. Growth / Value | Growth | Value | Growth |
| Cyclical Sectors / Defensive Sectors | Cyclical Sectors | Neutral | Cyclical Sectors |
| U.S. / International | U.S. | International | U.S. |
| Emerging Markets / Developed Markets | Neutral | Neutral | Emerging Markets |
Source: Direxion, as of October 31, 2019.
Definitions
- Russell 1000: The Russell 1000 Index consists of the largest 1,000 companies in the Russell 3000 Index, which is made up of 3,000 of the largest U.S. companies.
- Russell 2000: The Russell 2000 Index is comprised of the smallest 2000 companies in the Russell 3000 Index, representing approximately 8% of the Russell 3000 total market capitalization.
- Russell 1000 Growth: The Russell 1000 Growth Index measures the performance of those Russell 1000 companies with higher price-to-book ratios and higher forecasted growth values.
- Russell 1000 Value: The Russell 1000 Value Index measures the performance of those Russell 1000 companies with lower price-to-book ratios and lower forecasted growth values.
- MSCI USA Cyclical Sectors: The MSCI USA Cyclical Sectors Index is based on MSCI USA Index, its parent index and captures large and mid-cap segments of the US market. The index is designed to reflect the performance of the opportunity set of global cyclical companies across various GICS® sectors. All constituent securities from Consumer Discretionary, Financials, Industrials, Information Technology and Materials are included in the Index.
- MSCI USA Defensive Sectors: The MSCI USA Defensive Sectors Index is based on MSCI USA Index, its parent index and captures large and mid-cap segments of the US market. The index is designed to reflect the performance of the opportunity set of global defensive companies across various GICS® sectors. All constituent securities from Consumer Staples, Energy, Healthcare, Telecommunication Services and Utilities are included in the Index.
- FTSE All-World ex US: The FTSE All-World Excluding United States Index is a free float market capitalization weighted index. FTSE All-World Indices include constituents of the Large and Mid-capitalization universe for Developed and
Emerging Market segments. - MSCI EAFE IMI: The MSCI EAFE Investable Market Index (IMI), is an equity index which captures large, mid and small cap representation across Developed Markets countries around the world, excluding the US and Canada.
- MSCI Emerging Markets IMI: The MSCI Emerging Markets Investable Market Index (IMI) captures large, mid and small cap representation across 24 Emerging Markets (EM) countries.
Direxion Relative Weight ETF Risks: Investing involves risk including possible loss of principal. The ETFs’ investments in derivatives may pose risks in addition to, and greater than, those associated with directly investing in or shorting securities or other investments. There is no guarantee that the returns on an ETF’s long or short positions will produce high, or even positive returns and the ETF could lose money if either or both of the ETF’s long and short positions produce negative returns. Please see the summary and full prospectuses for a more complete description of these and other risks of the ETFs.
