
By David Mazza & Inkoo Kang, from Direxion
In 2019, investors waded through significant economic and geopolitical uncertainty to push U.S. equity markets to new all-time highs as the developments around Brexit and the U.S.-China trade negotiations arrived at less than dire outcomes. However, outside of the day-to-day headlines, economic data pointed to a continuation of the late cycle environment, emphasizing that bull markets do not simply die of old age. While we believe that equity markets will likely end 2020 higher, market risks seem skewed to the downside. On the other hand, economic risks have become more balanced as a result of a 180 degree shift in monetary policy year-over-year that is supportive for risk assets. The main challenge we see for markets is that the earnings recovery in 2020 is well priced into equities today, so we remain wary of the idea that valuations may begin to overshoot expectations for 2021 earnings. In fact, we see the chances of a valuation overshoot to be a real possibility as investors FOMO (fear missing out) on additional gains and the TINA (there is no alternative) mentality makes its way back into the markets. While the macro and monetary backdrop may be supportive for risk assets into 2020, the new fear is that of the fear… of missing out.
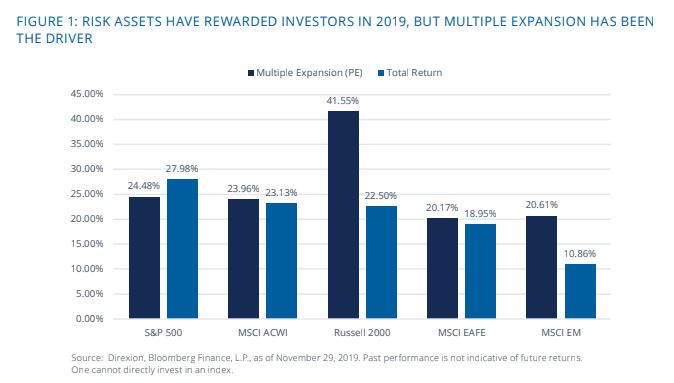
RISK ASSETS PERFORMED EXCEPTIONALLY WELL IN 2019
2019 was an exceptional year for risk assets, and for equities in particular. To put this into historical context, a 60/40 equity/ bond portfolio provided the best return in over 20 years, and the MSCI ACWI Index, which covers both Emerging and Developed markets, has provided over 23% in total return, marking one of the best years since the Global Financial Crisis. In the face of many macro challenges such as geopolitical risks stemming from Brexit and U.S. – China trade relations, equities enjoyed one of the best years in a decade, but a significant portion of total returns in 2019 have come from valuation expansion as we have seen muted growth in earnings and profits both here in the U.S. and abroad. While we can point to the drawdown in Q4 2018 and the low point in which we entered the year as a major contributor for 2019 returns, 2019 will be remembered for the stark shift in monetary policy in the U.S. and the reality of slowing growth even beyond the impact of trade tensions.
SLOW GROWTH AND RISING MULTIPLES
While slowing growth was a major story throughout 2019, the latter half of the year saw manufacturing data recover and undergo a bit of a bottoming-out process, and we continued to see signs of a robust consumer here in the U.S. As a result, U.S. large cap stocks were able to break out above its longer-term range (stretching back to September 2018) and mark new all-time highs throughout most of November. We view this as a reflection of the perceived relaxation of major geopolitical risks (especially U.S. – China trade) and some forward pricing-in of stronger economic recovery and results. Again, as multiples have expanded into the end of 2019, profits and earnings will have to prove that stocks deserve that greater multiple as we navigate 2020.
THE GLOBAL ECONOMY: SLOW GROW. NOT NO GROWTH.
Consensus expects that the global economy will grow by 3.1% – 3.4% in 2020. While the low-to-mid 3% growth for 2020 is a level that can support risk assets going forward, it is lower than what was seen over the prior five years, and notably lower than levels seen during the 2017 levels of “synchronized global growth” that drove similar levels of equity performance. Global inflation is expected to be consistent in 2019 to 2020, making the economic environment relatively status quo, and while progress has been made related to the ongoing U.S. – China trade saga, risks of a breakdown continues to remain, resulting in a still-heightened level of economic uncertainty. The major shift, in our view, is that global monetary policy has become decidedly dovish in the last year with major central banks including the Fed, ECB and BoJ all expanding their balance sheets in addition to lowering benchmark rates.
In the U.S., business investment has fallen for six straight months with Q3 being the lowest since 2015. Industrial production has been trending negatively as the trade war has weighed on global manufacturing. Taking some bottoming- out in global economic data into account and if positive developments regarding the trade war were to continue, we would expect business investment to also rebound. We continue to see a robust job market, but the gap between employment growth and wage growth is growing. The question remains how well the consumer can hold up if employment conditions weaken, which seems likely considering that companies closed 2019 by pulling back on capex.
On the positive side, inflation remains benign and may be in a sweet spot for the Federal Reserve. We believe that yields have increased due to a reassessment of worst case scenarios, not the start of a new growth cycle. That being said, the recovery of the U.S. yield curve has supported the idea of cyclical sector leadership late into 2019. Thanks to accommodative monetary policy, the yield curve will likely remain positively sloping, but the potential for materially higher longer duration rates will likely be capped.
INTERNATIONAL – A MIXED BAG
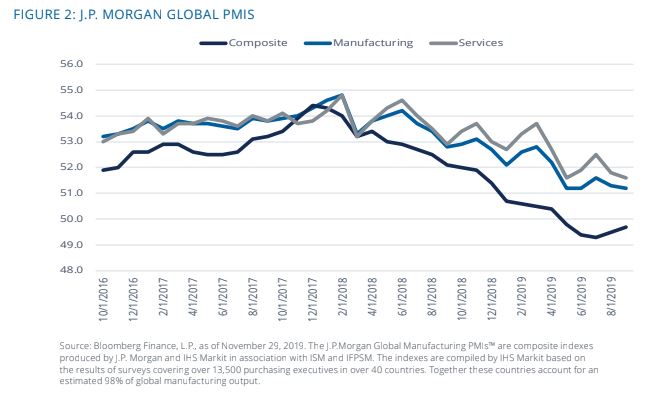
Outside of the U.S., we continue to see a mixed picture. On the positive side, global manufacturing data seems to have bottomed. When it began to contract, which was well before the trade war, that was the first sign of trouble for the overall growth picture, but it remains weak in China, Germany and Japan. These three countries see greater than 20% of their total value added coming from manufacturing, and in some cases, manufacturing weakness has spilled over into the rest of the economy as a result of the disruption in global trade. Of course, much of the ability for the global economy to either surprise to the up or downside will depend on the outcome of the trade deal and the outlook for additional tariffs.
We have seen some cracks in the credit market, especially among the weakest issuers, but the overall credit environment has held up well in this stage of the cycle. Investors have bifurcated their opinion on markets, between energy and non- energy issuers as the former has seen spreads widen and the latter tighten even as firms have increased leverage, their ability to service their debt remains strong. So, absent a material shock to cash flows (which we do not expect), we view credit quality within the broad U.S. large cap universe to remain robust in 2020, and the risk of credit spreads widening in a sustained and material way remain low.
WHERE ARE THE OPPORTUNITIES?
GROWTH OVER VALUE IS ALL ABOUT EARNINGS
Due to their continued stretched relative valuations, the growth versus value trade will become more episodic and volatile, just as we saw on occasion in the back half of 2019. However, until we see a true market correction driven by a recession, we believe that growth stocks will continue to outperform value stocks as the earnings potential for value remains poor compared to growth and in a continued low-growth environment, investors will ultimately flock to growth.
CYCLICALS OVER DEFENSIVES HELPED BY FINANCIALS
The overweight of cyclical sectors relative to defensive sectors is less cut and dry thanks to their unique compositions. For example, the three most overvalued (through both aggregate and relative lenses) sectors are utilities, consumer discretionary and information technology. This highlights how investors have bid up the prices in both the highest growth areas of the market (discretionary and tech), and one of its safest (utilities). We believe that cyclicals are better positioned for 2020 thanks to their higher quality profile. We also like the intersection of value and economic cyclicality represented by the Financials sector, which is a considerable portion of the cyclicals basket.
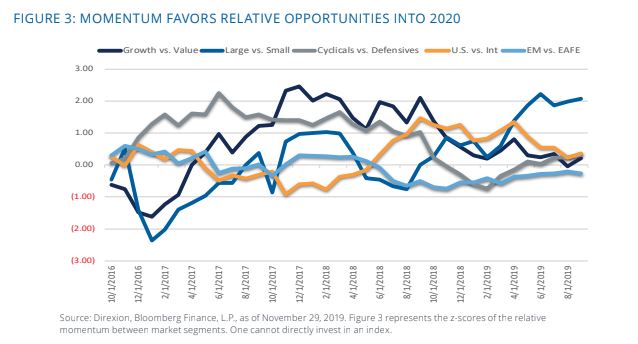
Many of these opportunities stem from the dynamics under the hood of broader equity performance in 2019, as they give us some clues towards the markets’ perceptions of risks going forward into 2020. The stark leadership in cyclical stocks (especially Cyclicals ex-Energy) relative to defensives tells us that the market is optimistic, and seemingly more confident, about growth prospects heading in 2020, especially relative to what we saw in 2019. These expectations, which we categorize as “modestly positive,” in addition to the expectations of muted inflation and yields, should provide further runway for growth relative to value.
OPPORTUNITY OUTSIDE THE U.S.
An area that we see greater value opportunities is outside of the U.S. with international developed and emerging markets trading at significantly depressed historical multiples. With the removal of Brexit uncertainties and lessening of trade tensions, the overhang of issues surrounding markets outside of the U.S. is supportive for those markets going forward.
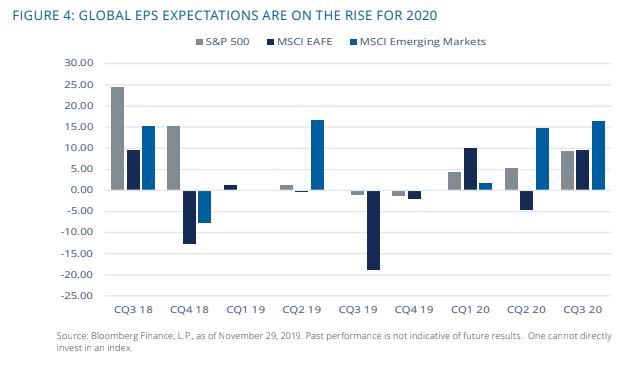
With multiples high across the board, especially in the U.S., investors will be banking on earnings matching valuations to help boost markets along with the overall supportive macro backdrop. As of this writing, expectations are for earnings per share growth to recover markedly from this year’s low levels, with earnings growth being particularly strong outside of the U.S. While these estimates will likely decline based on historical precedent, returns for 2020 will need to be driven by investors paying up for earnings, which is consistent with what we saw this year.
CURRENT POSITIONING ACROSS MARKETS
Figure 5 highlights the current positioning of our quantitatively-based relative weight expectations model. These views are recalibrated monthly based on composite measures of momentum and valuation. The momentum composite represents a blend of the 3, 6, 9, and 12-month total returns on a relative basis between the market segment pairs, and the valuation composite represents the relative valuations based on price-to-earnings, price-to-book, and price-to-sales.
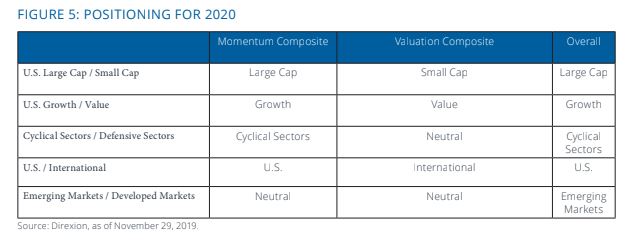
Our positioning reflects both expectations for returns throughout different pockets of the U.S. and International equity markets, as well as the expectations that certain dynamics for market leadership are poised to continue into 2020. While the macro backdrop should be generally favorable for equity markets for the near term, we remain aware that the valuation expansion in 2019 implies that the majority of economic and earnings expectations are well priced-in. The upcoming U.S. election presents a wide range of potential outcomes for risk assets, but our positioning largely reflects greater confidence in equities for 2020 albeit with much lower return expectations than 2019.
DEFINITIONS
- S&P 500: Standard & Poor’s® selects the stocks comprising the S&P 500® Index on the basis of market capitalization, financial viability of the company and the public float, liquidity and price of a company’s shares outstanding. The Index is a float-adjusted, market capitalization-weighted index.
- Russell 1000: The Russell 1000 Index consists of the largest 1,000 companies in the Russell 3000 Index, which is made up of 3,000 of the largest U.S. companies.
- Russell 2000: The Russell 2000 Index is comprised of the smallest 2000 companies in the Russell 3000 Index, representing approximately 8% of the Russell 3000 total market capitalization.
- MSCI ACWI: The MSCI ACWI, is an equity index which captures large and mid cap representation across Developed Markets and Emerging countries around the world.
- MSCI EAFE IMI: The MSCI EAFE Investable Market Index (IMI), is an equity index which captures large, mid and small cap representation across Developed Markets countries around the world, excluding the US and Canada.
- MSCI Emerging Markets IMI: The MSCI Emerging Markets Investable Market Index (IMI) captures large, mid and small cap representation across Emerging Markets countries around the world.
- Russell 1000 Growth: The Russell 1000 Growth Index measures the performance of those Russell 1000 companies with higher price-to-book ratios and higher forecasted growth values.
- Russell 1000 Value: The Russell 1000 Value Index measures the performance of those Russell 1000 companies with lower price to-book ratios and lower forecasted growth values.
- MSCI USA Cyclical Sectors: The MSCI USA Cyclical Sectors Index is based on MSCI USA Index, its parent index and captures large and mid-cap segments of the US market. The index is designed to reflect the performance of the opportunity set of global cyclical companies across various GICS® sectors. All constituent securities from Consumer Discretionary, Financials, Industrials,Information Technology and Materials are included in the Index.
- MSCI USA Defensive Sectors: The MSCI USA Defensive Sectors Index is based on MSCI USA Index, its parent index and captures large and mid-cap segments of the US market. The index is designed to reflect the performance of the opportunity set of global defensive companies across various GICS® sectors. All constituent securities from Consumer Staples, Energy, Healthcare, Telecommunication Services and Utilities are included in the Index.
- FTSE All-World ex US: The FTSE All-World Excluding United States Index is a free float market capitalization weighted index. FTSE All-World Indices include constituents of the Large and Mid-capitalization universe for Developed and Emerging Market segments.
An investor should carefully consider a Fund’s investment objective, risks, charges, and expenses before investing. A Fund’s prospectus and summary prospectus contain this and other information about the Direxion Shares. To obtain a Fund’s prospectus and summary prospectus call 866-476-7523 or visit our website at direxion.com. A Fund’s prospectus and summary prospectus should be read carefully before investing.
Direxion Relative Weight ETFs Risks – Investing involves risk including possible loss of principal. The ETFs’ investments in derivatives may pose risks in addition to, and greater than, those associated with directly investing in or shorting securities or other investments. There is no guarantee that the returns on an ETF’s long or short positions will produce high, or even positive returns and the ETF could lose money if either or both of the ETF’s long and short positions produce negative returns. Please see the summary and full prospectuses for a more complete description of these and other risks of the ETFs. Distributor for Direxion Shares: Foreside Fund Services, LLC.
